
Figure 11.
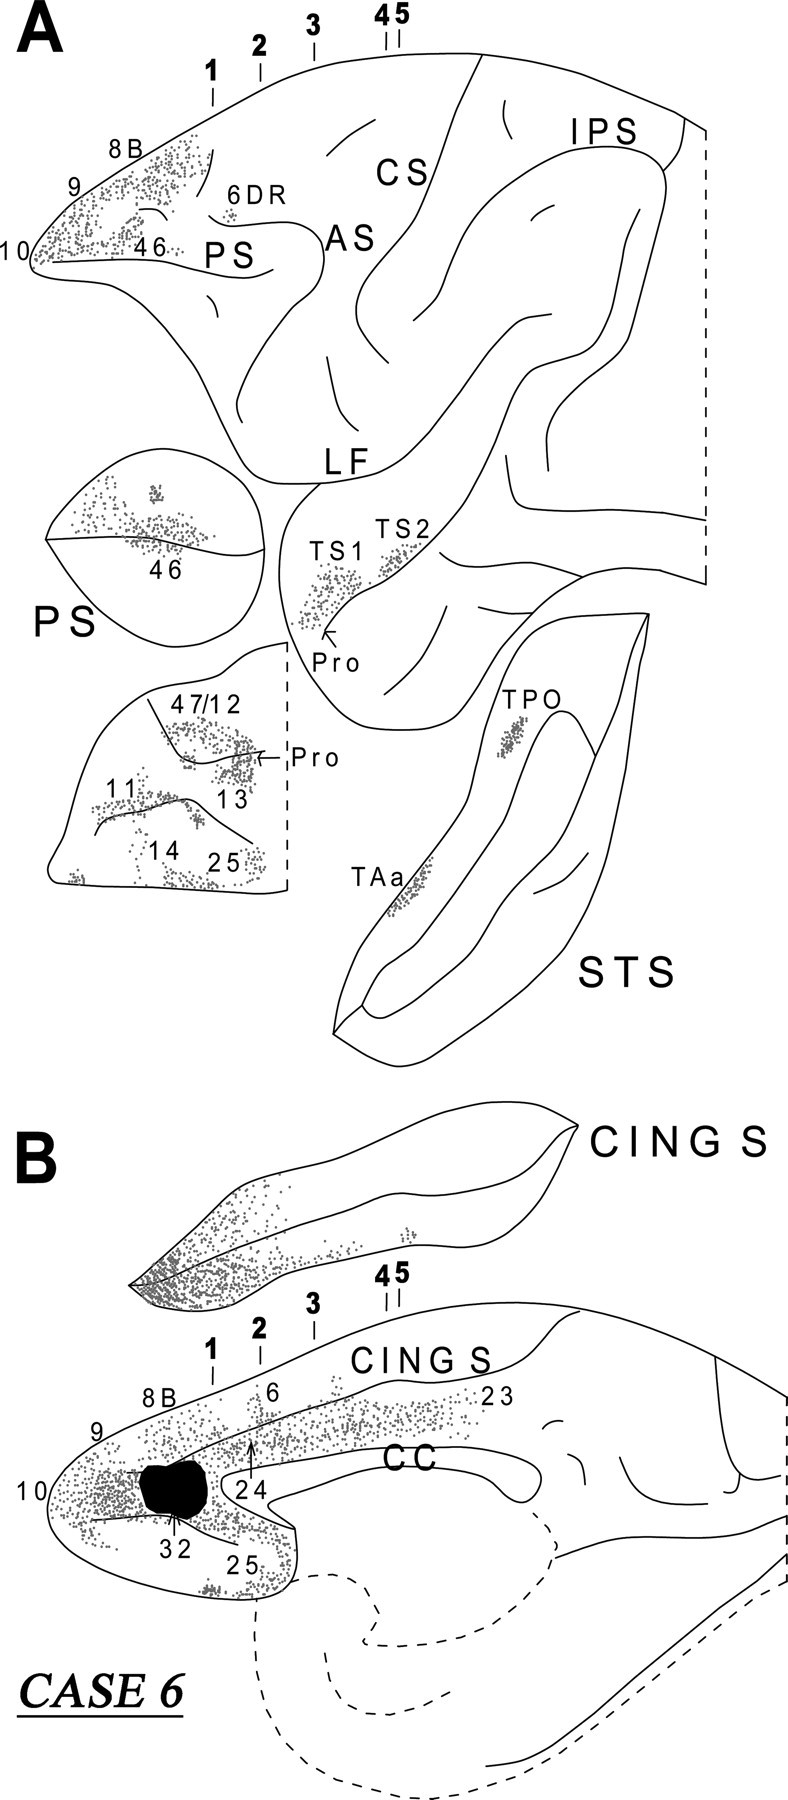
Diagrammatic representation of the unfolded lateral (A) and medial (B) surfaces of the cerebral hemisphere in case 6 with isotope injection in area 32 (shown in solid black) and the resulting distribution of terminal label (shown as dots). In A, the principal sulcus and the superior temporal sulcus and, in B, the cingulate sulcus have been opened up to show the terminal label in their banks. For abbreviations, see Figure 3.