
Figure 5.
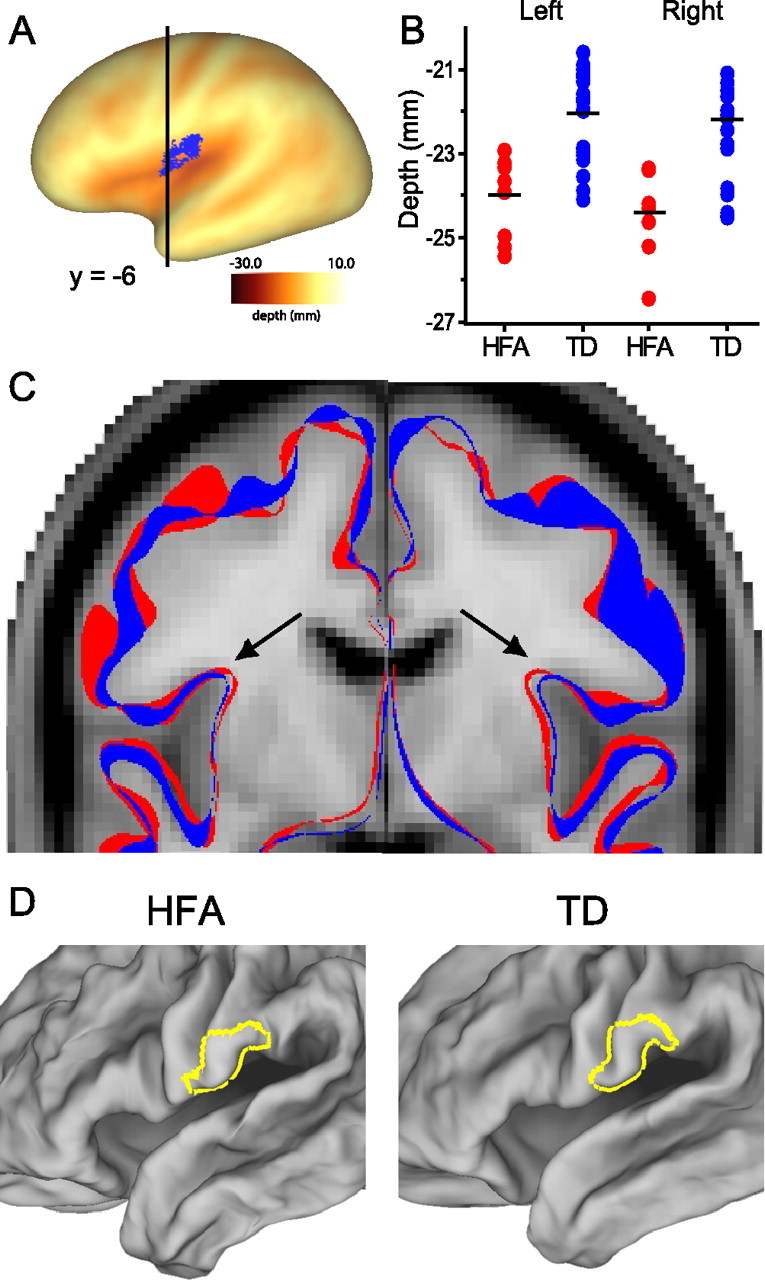
Visualization of the folding abnormality in the HFA group in children. A, The HFA cluster in the parietal operculum identified by the cluster size analysis is shown on the left hemisphere PALS-B12 very inflated surface. The black line denotes the location of the coronal slice depicted in C. B, Plots of individual mean depths within the left and right significant clusters for HFA and TD groups. C, Outlines of group-averaged fiducial surfaces (HFA in red; TD in blue) are overlaid onto the MNI-152 MRI template. The black arrow indicates the location of the cluster in the parietal operculum. The HFA surface is deeper than the TD surface by ∼1 mm. D, The yellow outline overlaid onto group-averaged HFA and TD fiducial surfaces depicts the location of the putative gyral shape abnormality in ventral postcentral gyrus. Note that although the right hemisphere is not depicted in A or D, the abnormality is bilateral, and the corresponding region in the right hemisphere is also affected.