
Figure 1.
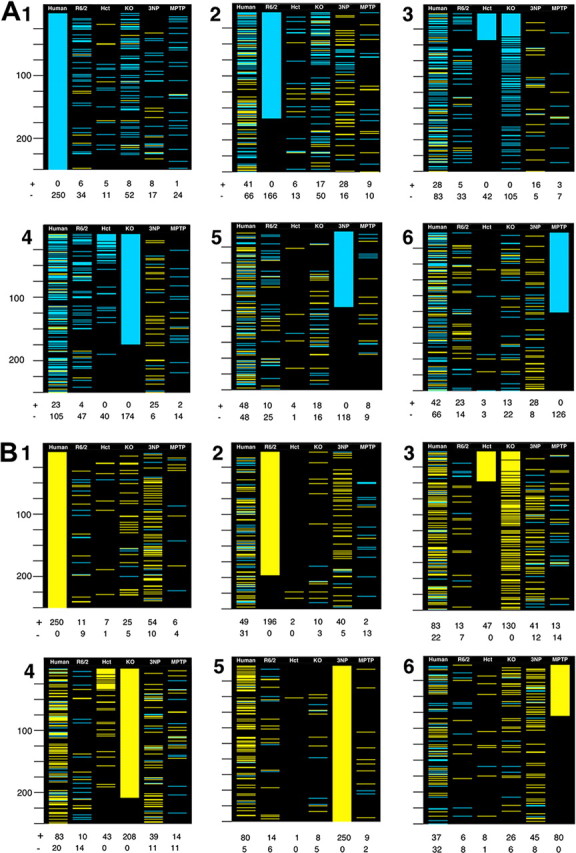
Visualization of concordance and symmetry between the most statistically significant changes in human HD caudate and HD models. To give visual weight to the genes with the greatest evidence for differential expression, genes meeting p < 0.001 for differential expression are colored blue if they decrease in human or model HD and colored yellow if they increase in human or model HD. In A, the top decreasing genes in each system are considered. In B, the top increasing genes in each system are considered. In 1–6 of A and B, genes common to all four array types are sequentially ranked by the p values for differential expression in human HD caudate and HD models. 1, Sorted by human HD; 2, sorted by R6/2 mouse; 3, sorted by BDNF HET mouse; 4, sorted by Emx-BDNF KO mouse; 5, sorted by 3NP-treated rat; 6, sorted by MPTP-treated mouse. Below each 250-gene column is a count of the number of genes that meet the p < 0.001 criteria in that column, with + signifying increased and − signifying decreased in HD relative to controls. Twenty-five-gene intervals are marked on the left side of each panel.