
Figure 2.
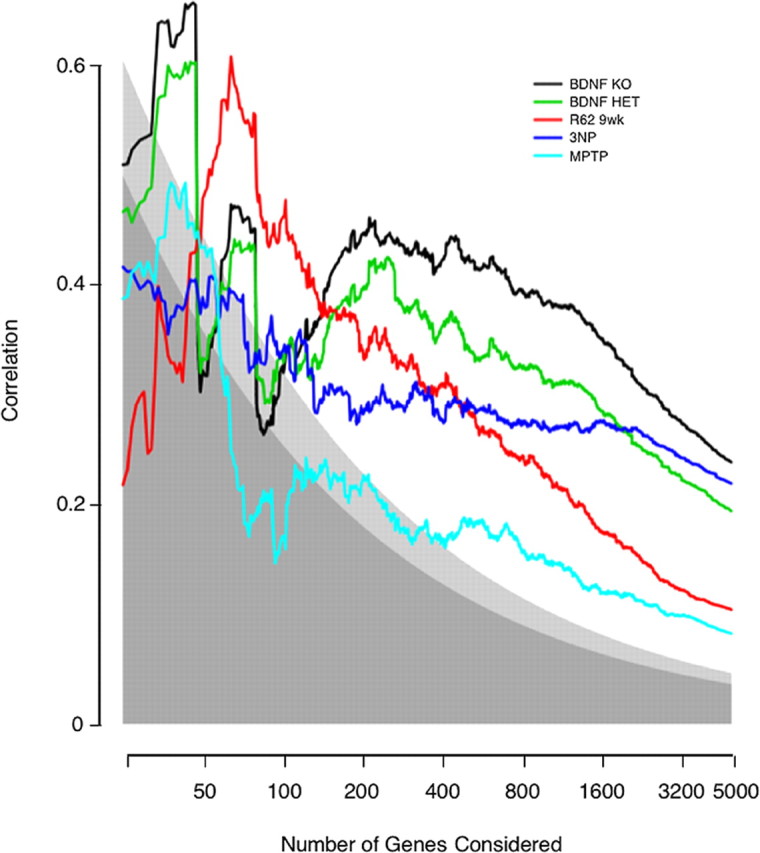
Correlation between effects in human HD caudate and effects in HD models. Genes were ranked by their p values for differential expression in human HD caudate. Then, separately for each model, Pearson's correlation coefficients between human and HD-model log ratios were computed for the top x genes, where x ranges from 25 genes to all 4992 genes common to the four array types. Correlation is plotted on the y-axis, and the number of genes under consideration is plotted on the x-axis. Shading indicates the statistical significance of the observed correlation. Points falling within the darkest gray have a statistical significance of p > 0.01; within the lightest gray, p between 0.01 and 0.001; within the area of no shading, p < 0.001.