
Table 3.
The most highly overrepresented upregulated and downregulated gene ontology functions and processes in human HD caudate and model systems
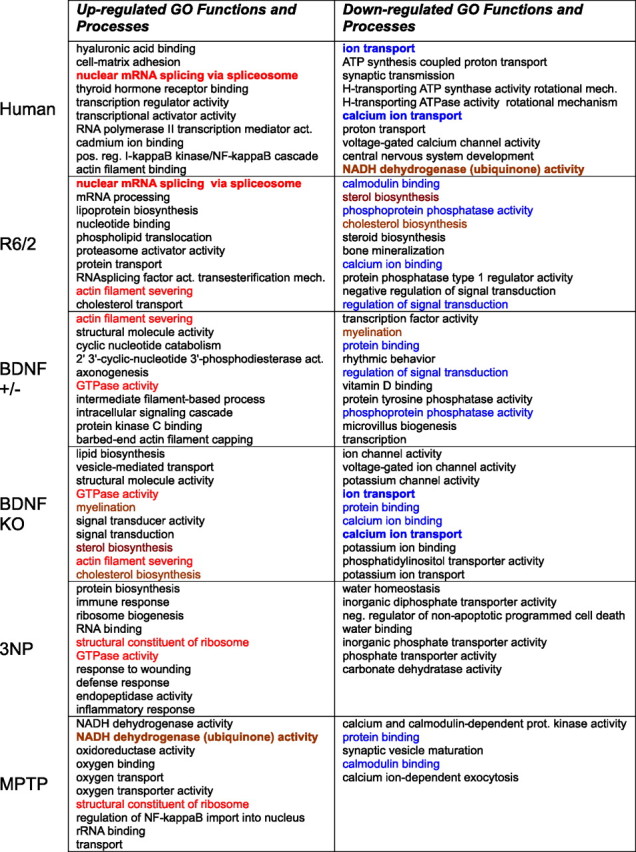
Categories were ranked by p value for overrepresentation. The top 10 categories, as ranked by p value, meeting p < 0.001 for overrepresentation are shown. Less than 10 categories are shown if fewer met the p < 0.001 criterion. Red type indicates congruent upregulated categories appearing in the table in two or more systems. Blue type indicates congruent downregulated categories. Brown type indicates incongruent changes. Bold type indicates intersection between human HD and a model.