
Figure 5.
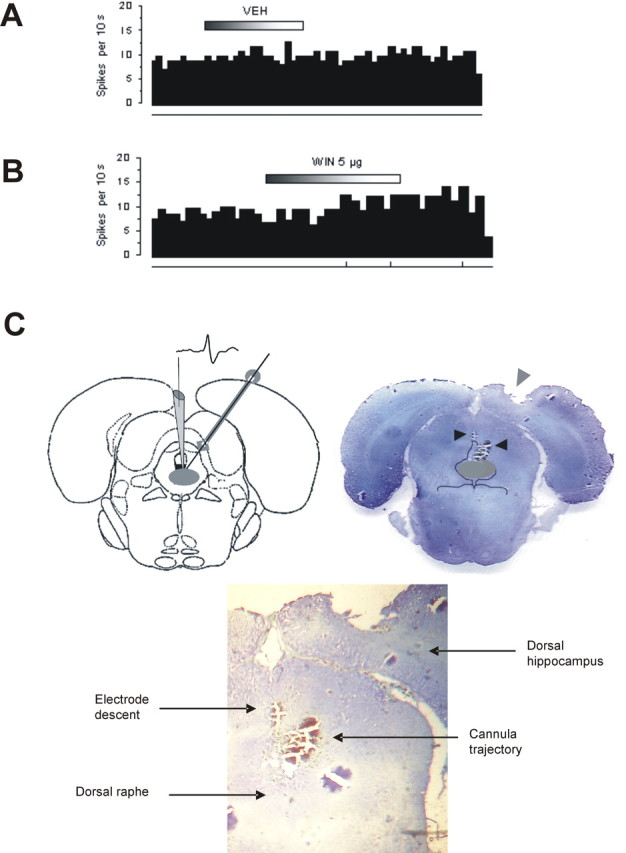
Effect of WIN microinfused into the DR. A, Integrated firing rate histogram of a 5-HT neuron before and after intra-DR microinfusion of vehicle (0.5 μl) (n = 3 neurons). B, Integrated firing rate histogram of a 5-HT neuron before and after intra-DR microinfusion of WIN (5 μg in 0.5 μl of vehicle) showing a slight increase in single-unit firing activity immediately after infusion observed in one of four neurons. Among the other three neurons, one showed a decrease whereas the other two did not respond at all. On each histogram, 5-HT neuronal firing rate is plotted as spikes per 10 s. Horizontal bar on top represents the time course of infusion, and vertical lines at the bottom represent the frequency of neuronal burst activity such that each tick corresponds to a burst event. C, Left, An illustrative depiction of the electrode descent into the DR (shaded gray area) and the trajectory of the microcannula based on the stereotaxic atlas of Paxinos and Watson (1986). Right, Histological verification of lesions imprinted by the electrode descent (left arrow) and of the microcannula (right arrow) on a coronal brain section (∼1.2 anterior to interaural zero) showing the DR (shaded gray area). Bottom, Closer inspection of lesion traces.