
Figure 6.
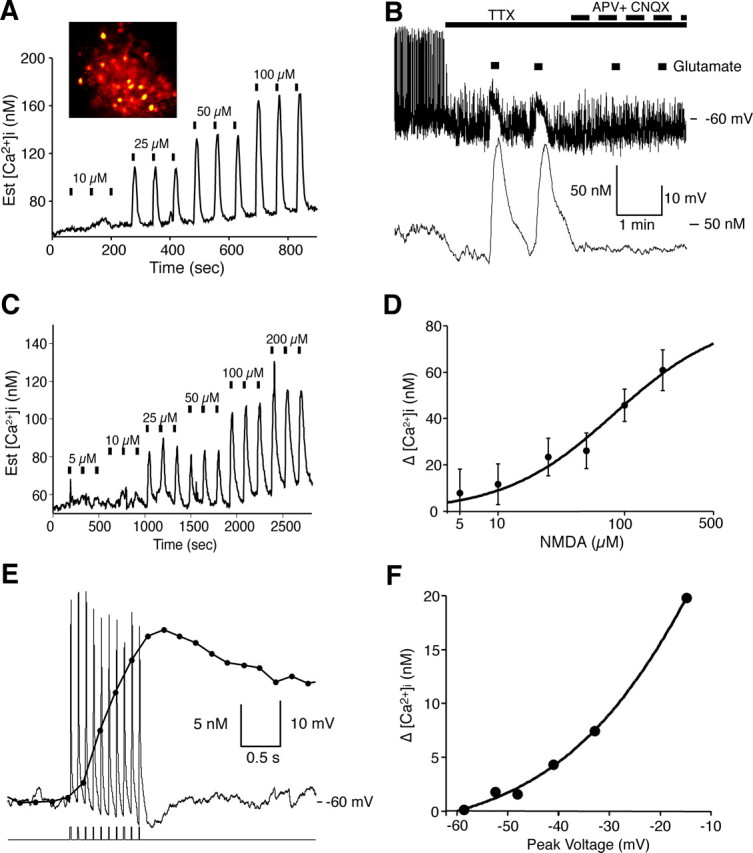
Glutamate evoked [Ca2+]i transients in adult SCN neurons. A, The mean change in [Ca2+]i in 27 simultaneously recorded SCN neurons induced by glutamate. Bars indicate a 10 s glutamate treatment. The inset shows fura-2-loaded SCN cells. The concentration response relationship of this experiment had an EC50 of 31 μm for glutamate. B, Glutamate induced [Ca2+]i transients and membrane depolarizations that were blocked by APV (50 μm) and CNQX (10 μm) in a current-clamped SCN neuron during the day. C, The amplitude of NMDA-evoked [Ca2+]i transients was dependent on the NMDA concentration. Bars indicate a 15 s exposure to NMDA. D, Concentration–response curve for NMDA-induced Δ[Ca2+]i, in which each point represents the mean ± SEM of 5–10 cells from four different experiments. The EC50 value for NMDA was estimated to be 83 μm. E, Example showing the change in [Ca2+]i in response to membrane depolarization in a current-clamped SCN neuron. The neuron was depolarized with 10 pulses (100 pA, 10 ms) in the presence of picrotoxin (50 μm) and TTX (0.5 μm). The corresponding rise and fall of somatic [Ca2+]i was similar to that evoked by action potentials. F, The change in Ca2+ was plotted versus the peak membrane potential reached after current injection (10 pulses of 10, 20, 40, 60, or 100 pA at 10 Hz) in the same neuron. Est., Estimated.