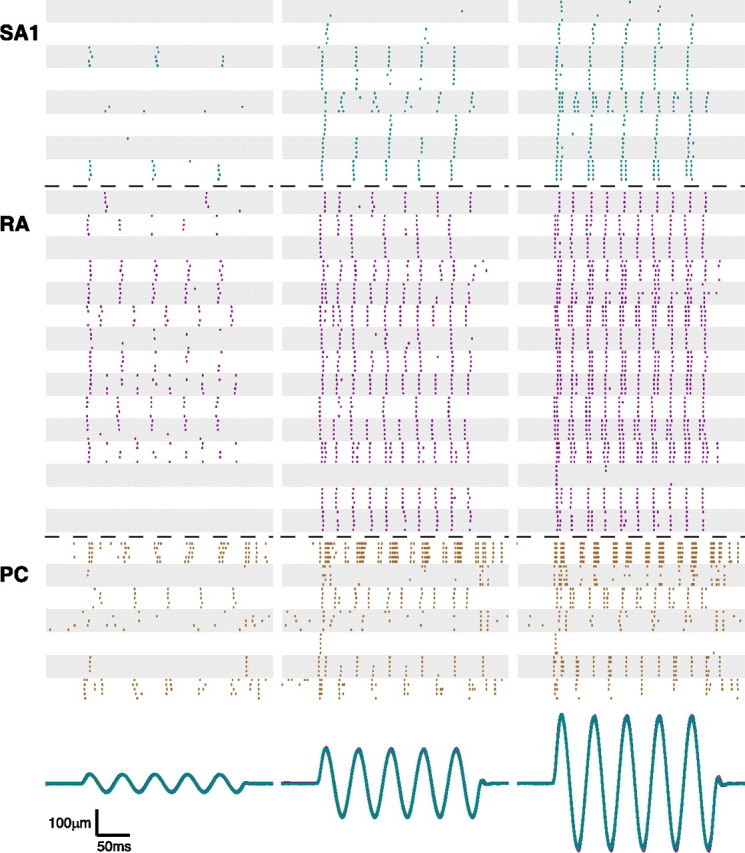
Figure 1.

Spike-time rasters showing the responses of 8 SA1 (cyan), 15 RA (magenta), and 7 PC (brown) afferents to a 20 Hz sinusoid with amplitudes of 35 (left), 130 (center), and 250 μm (right). Each alternating shaded and unshaded patch corresponds to the responses of a given afferent to five presentations of the same stimulus. The bottom traces show the stimulus position as a function of time for all of the stimulus presentations.
