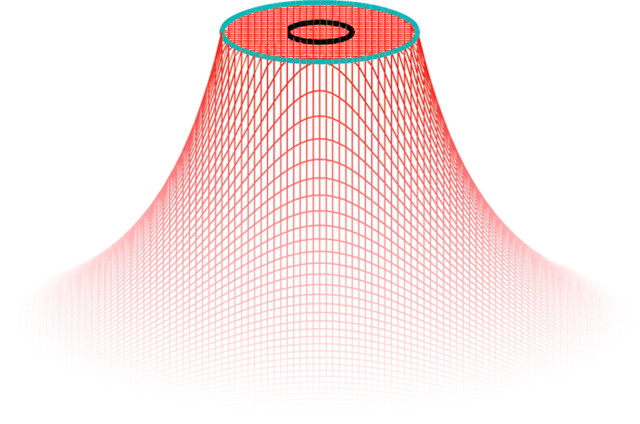
Figure 10.
Spatial distribution of the effective amplitude, A(r), of the stimulus; A(r) drops off as an inverse square function of distance beyond an annulus 1 mm away from the probe edge (see Eq. 3). The black contour indicates the location and extent of the contactor (r = 0.5 mm). The term “hot zone” refers to the area under this blue contour, an area over which the effective amplitude is constant at A0.

