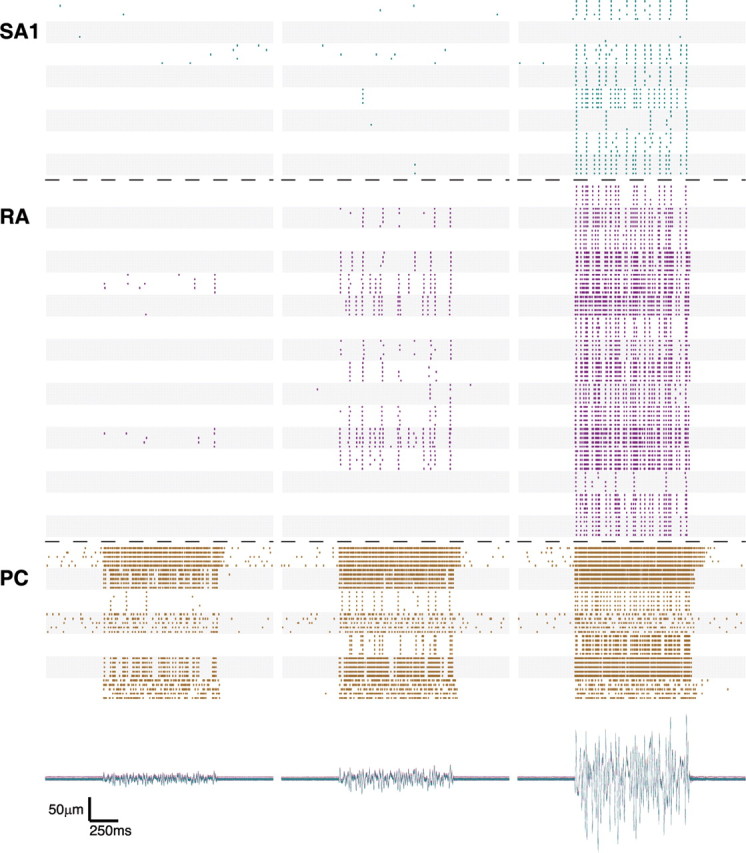
Figure 2.

Spike-time rasters showing the responses of 8 SA1 (cyan), 16 RA (magenta), and 7 PC (brown) afferents to bandpass noise (5–100 Hz) with rms amplitudes of 5 (left), 10 (center), and 50 (right) μm. Each alternating shaded and unshaded patch corresponds to the responses of a given afferent to five presentations of the same stimulus. The bottom traces show the stimulus position as a function of time for all of the stimulus presentations. From the almost complete overlap of the traces, it can be seen that the stimulus was remarkably consistent across recording days.
