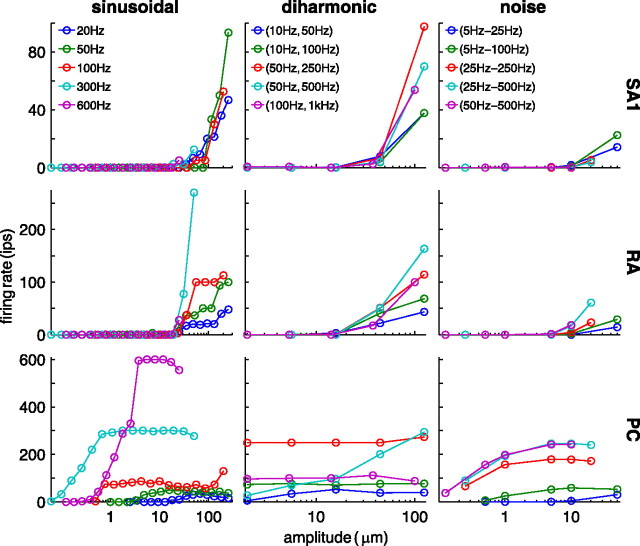
Figure 3.
Rate–intensity functions obtained from a typical SA1 (top), RA (middle), and PC (bottom) afferent for a subset of sinusoidal (left), diharmonic (center), and noise (right) stimuli. For the diharmonic stimuli, each trace corresponds to the pair of frequencies specified in the legend; rates are plotted as a function of the amplitude of the low-frequency component (the relative amplitudes of the high-frequency components depend on their frequency; see Materials and Methods); for the noise stimuli, each trace shows afferent responses to stimuli with the low- and high-frequency cutoffs specified in the legend. ips, Impulses per second.

