Figure 9.
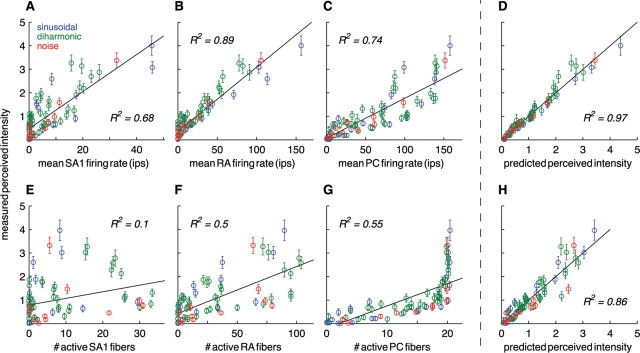
A–C, Perceived intensity ratings plotted against the mean firing rate evoked in SA1 (A), RA (B), and PC (C) afferents. D, Predictions derived from the multiple regression of perceived intensity on the population firing rates in the three types of afferents. The three slope coefficients (βSA1 = 0.29, βRA = 0.36, and βPC = 0.46) are highly significant (p < 0.001), indicating that all three types of mechanoreceptive afferents contribute to perceived intensity. E–G, Perceived intensity versus the number of active SA1 (E), RA (F), and PC (G) afferents. As can be seen, PC recruitment is a poor code for perceived intensity because it saturates at low stimulus intensities. H, Relationship between the measured perceived intensity and the predicted perceived intensity from the multiple regression model. ips, Impulses per second.

