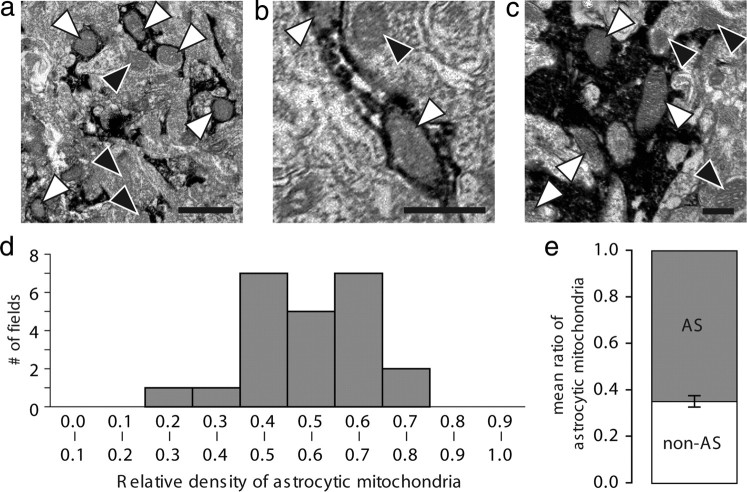
Figure 6.
Electron microscopy images of mitochondria in astrocytic processes. Cortical sections were prepared from GFAP–GFP mice and immunolabeled against GFP. GFP-positive astrocytes throughout the cortical layers were evaluated. a–c, Representative EM images of different sizes in astrocytic processes immunolabeled against GFP. GFP+ astrocytic mitochondria are indicated with white arrowheads, and nonastrocytic mitochondria are indicated with black arrowheads. Note a relative higher number of astrocytes in astrocytic processes compared with surrounding neuropil. Scale bars: a, 1 μm; b, 0.5 μm; c, 0.5 μm. d, Plot of the relative density of astrocytic mitochondria compared the density of mitochondria in the surrounding neuropil. The relative density of mitochondria was defined as number of mitochondria in astrocytic processes (defined by the staining for GFP) versus the relative number of mitochondria in rest of the section (not stained for GFP). The relative density of mitochondria was quantified in a total of 23 sections from three animals. e, Comparison of the mean of the density of mitochondria in and outside GFP-positive astrocytic (AS) processes in the same sections plotted in d (Student's t test).

