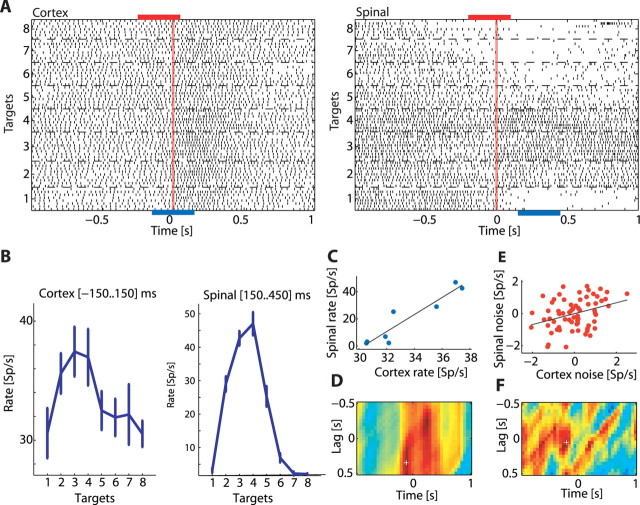
Figure 4.
Computing signal and noise correlation matrices for a pair of neurons recorded simultaneously. A, Raster displays of a cortical neuron (left) and a spinal interneuron (right) recorded simultaneously. Trials were aligned on torque onset and sorted by target. The blue bars below the raster displays represent two sample windows for which neuronal tuning curves were computed. The red bars above the raster display represent two different sample windows for which neuronal noise (trial-by-trial deviation from the signal) was computed. Note that the time window used for computing cortical signal and noise was not necessarily aligned with the time window used for computing spinal signal and noise as signal and noise correlation were measured at different corticospinal lags (see Materials and Methods). B, tuning curves computed for the cortical neuron (left) and spinal interneuron (right) in the selected sample windows (exact times appear in each panel). Both neurons showed a similar tuning profile. C, Correlation between tuning curves reveals a strong positive correlation. D, Time resolved signal correlation matrix shows the signal correlation coefficient for different combinations of cortical and spinal sample windows. The x-axis corresponds to the time (relative to torque onset) used as the center of the cortical sample window. The y-axis is the CS lag between the two sample windows, with positive lags corresponding to cortex leading the spinal cord. The color corresponds to the magnitude of the correlation coefficient (red, positive; blue, negative; green, zero). White cross indicates the point that corresponds to the (signal) sample windows shown previously. E, Noise correlation computed using the trial-by-trial deviation of neuronal firing from the mean discharge rate. Each dot represents the relation between the firing deviation of the spinal neurons (y-axis) with the corresponding deviation of the cortical neurons in a single trial. F, Time-resolved noise correlation matrix shows the noise correlation coefficient for different combinations of cortical and spinal sample windows. The layout is similar to the one used for the signal correlation matrix. White cross marks the point that corresponds to the (noise) sample windows shown previously.

