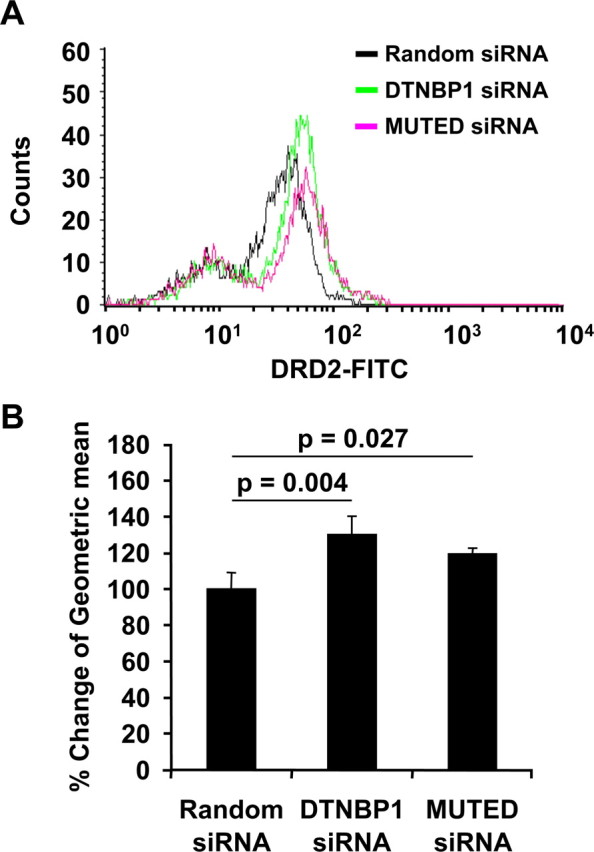
Figure 1.

Effects of siRNA on cell surface levels of DRD2 in SH-SY5Y cells. A, Representative data from flow cytometric analysis of cell surface DRD2 expression. The overlaid histogram shows relative fluorescence intensities of DRD2 from 10,000 cells transfected with either random siRNA (black), DTNBP1 siRNA (green), or MUTED siRNA (pink). B, Changes in cell surface DRD2 expression by DTNBP1 siRNA or MUTED siRNA transfection. The geometric mean of the DRD2 fluorescence signal was obtained by flow cytometric analysis. Values are expressed as a percentage of random siRNA transfected cells. Error bars represent means ± SD (n = 3).
