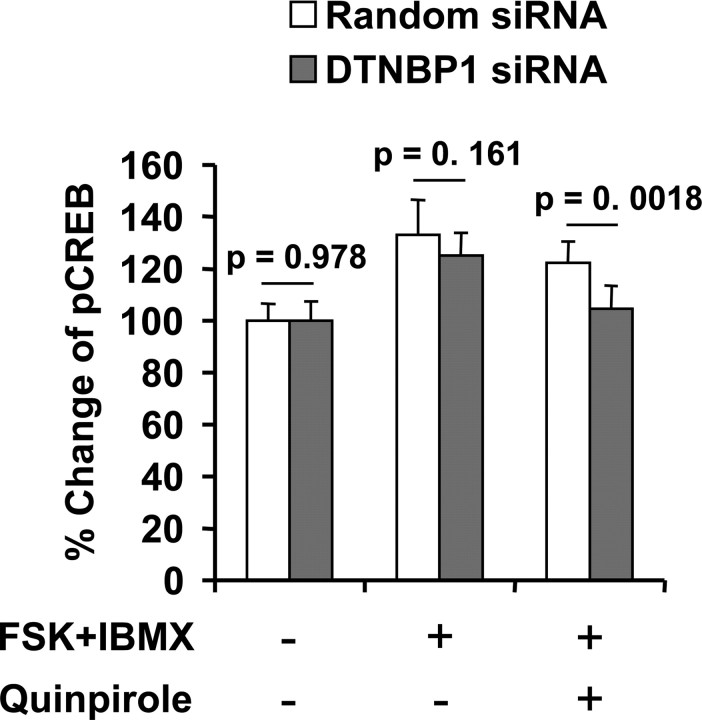
Figure 4.
Effects of DTNBP1 siRNA on CREB phosphorylation in rat primary neurons. Bars represent the percentage change in geometric mean of phospho-CREB fluorescence, assayed by flow cytometry with anti-pCREB antibody. Pretreatment with 50 μm forskolin (FSK) and 20 μm IBMX for 30 min was followed by the addition of 10 μm quinpirole for 20 min at 37°C. Error bars represent means ± SD (n = 6).

