
Figure 6.
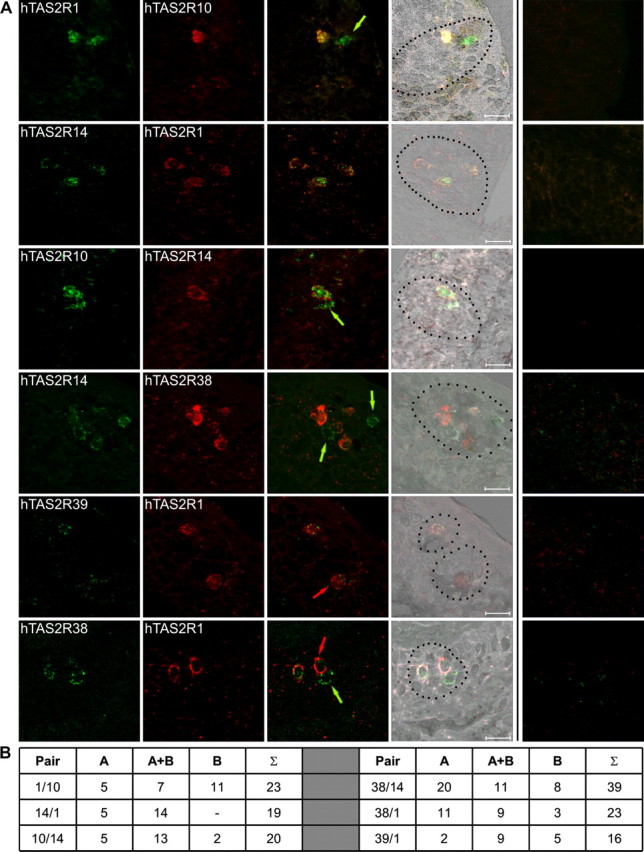
Dual-color in situ hybridizations of selected pairs of bitter receptor mRNAs. A, Dual-color in situ hybridizations were done using digoxigenin-labeled antisense riboprobes and fluorescein-labeled antisense riboprobes for the simultaneous detection of pairs of hTAS2R mRNAs. For the detection of hybridization signals, an anti-digoxigenin antibody coupled to horseradish peroxidase was used in combination with fluorescein–tyramide solution, resulting in a green fluorescent color precipitate shown in the first row. The fluorescein-labeled probes were detected with an anti-fluorescein antibody coupled to alkaline phosphatase in combination with fast red solution, leading to a red fluorescent color precipitate shown in the second row. Overlays of green and red channels are shown in the third row. Overlays superimposed onto topographical black and white images are depicted in the fourth row. Overlays of the green and red channels obtained after in situ hybridizations with the corresponding sense probes are depicted in the fifth row for negative controls. Pairs of receptors used for dual-color in situ hybridizations were as follows (from top to bottom): hTAS2R1 (green) and hTAS2R10 (red); hTAS2R14 (green) and hTAS2R1 (red); hTAS2R10 (green) and hTAS2R14 (red); hTAS2R14 (green) and hTAS2R38 (red); hTAS2R39 (green) and hTAS2R1 (red); hTAS2R38 (green) and hTAS2R1 (red). Pictures were taken by confocal laser scanning microscopy (Leica TCS SP2) of the entire depth of the tissue. The resulting z-stack was flattened using the averaging function of the Leica confocal software. Cells expressing only a single receptor are labeled with arrows in the corresponding color. Scale bars, 20 μm. B, Quantification of the number of cells expressing receptor A, receptor A together with receptor B (A+B), or only receptor B for each pair of receptors used for dual-label in situ hybridizations.