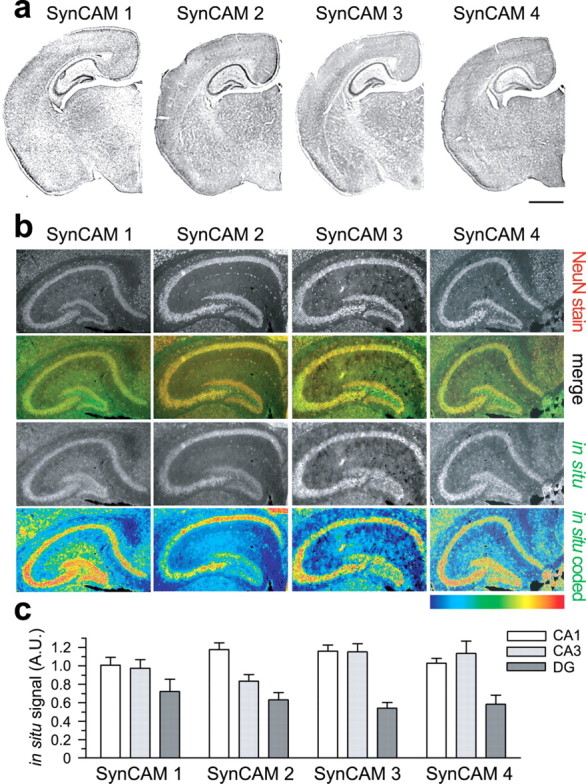
Figure 2.

SynCAM proteins are predominantly expressed in neurons and display differential expression patterns in the hippocampus. a, SynCAM family members are broadly expressed in forebrain regions. Coronal sections of mouse brain at P15 were analyzed by in situ hybridization. No region was seen that lacked SynCAM staining. Scale bar, 1 mm. b, SynCAMs are expressed by neurons in the hippocampus at P15 in overlapping but distinct patterns. Immunostaining for the neuronal nuclear marker NeuN (top row) was performed in parallel with in situ hybridization for SynCAMs (third row). The merged images show that most SynCAM-expressing cells are positive for NeuN (second row; NeuN staining, red; SynCAM hybridization signal, green). Pyramidal cells of the CA fields and granule cells of the dentate gyrus differed in SynCAM expression as visualized by pseudocolor rendering of the in situ hybridization signals (bottom row). The color code shown represents signal intensities (blue, lowest signal; red, highest). SynCAM 1 displayed uniform expression across the three examined regions, whereas SynCAM 2 is more prominent in the CA1 field. SynCAM 3 and 4 appear enriched in CA1 and CA3 fields relative to dentate gyrus. Results are quantitated in c. Images correspond to typical results from four hippocampi of two mice. c, Quantification of regional SynCAM expression differences in P15 hippocampus. The pyramidal cell layers of the CA fields and granule cell layer of the dentate gyrus were outlined, and the fluorescent in situ hybridization signal in each hippocampal region was normalized to the total signal and to the area of the individual region. Bar graphs show average SynCAM transcript hybridization signals ±SEM for four hippocampi from two animals analyzed by in situ hybridization. A.U., Arbitrary units.
