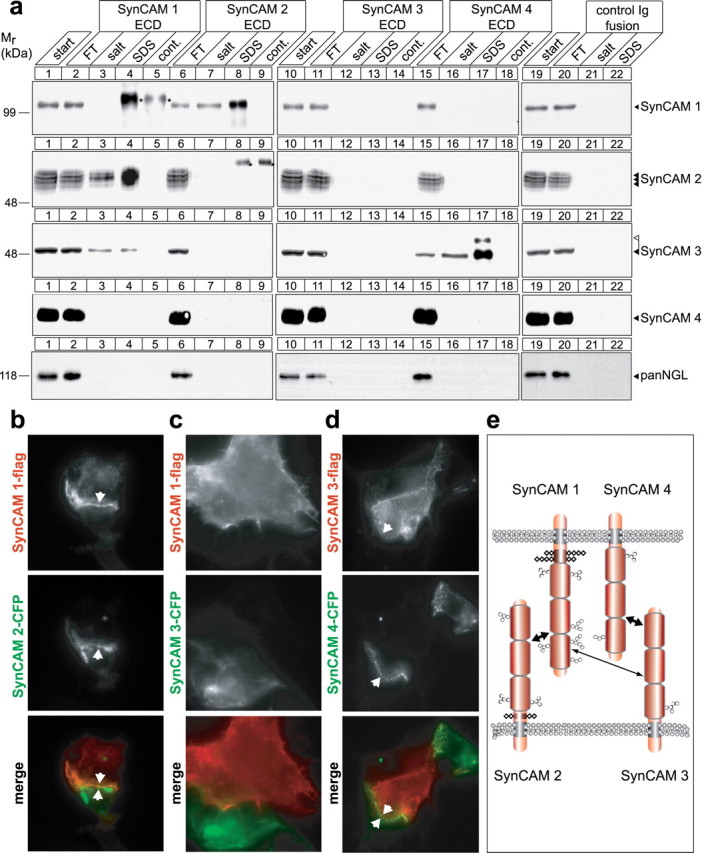
Figure 6.

Specific heterophilic interactions define cognate SynCAMs to mediate cell adhesion. a, Analysis of SynCAM interactions by affinity chromatography. Membrane proteins from adult rat forebrains were solubilized to obtain a detergent extract (lanes 1, 10, 19) and loaded on beads containing covalently immobilized extracellular domains of SynCAM 1 (lanes 2–4), SynCAM 2 (lanes 6–8), SynCAM 3 (11–13), SynCAM 4 (15–17), or a control Ig protein (lanes 20–22). The flow-through (FT) of each affinity chromatography was obtained, beads were washed, subsequently eluted with buffer containing high salt at 800 mm, and finally eluted with SDS. Samples were analyzed by immunoblotting for each of the four SynCAM proteins as shown, using monoclonal chicken antibodies to detect SynCAM 1, and with an antibody detecting the NGL family of synaptic membrane proteins as negative control. To control for cross-reactivity of anti-SynCAM antibodies with SynCAM extracellular domains used as affinity matrix that were washed off the beads and were present in the eluate samples, beads containing only the purified extracellular domains were eluted with SDS, and an eluate amount equal to the respective affinity chromatography fraction was loaded (lanes 5, 9, 14, 18). Antibody cross-reactive bands are marked by asterisks. Strong heterophilic and reciprocal binding of SynCAM 1 (first row, lanes 7, 8) and SynCAM 2 (second row, lanes 3, 4) is observed, causing their significant reduction in the respective FT fractions consistent with their high yield in the eluates. SynCAM 1 homophilic retention on its extracellular domain was weak and only detected after long immunoblot exposures (data not shown). SynCAM 3 is retained strongly in both its lower and higher molecular weight forms on SynCAM 4 (third row of panels, lanes 16, 17), and a weaker interaction of SynCAM 3 with SynCAM 1 is also observed (third row, lanes 3, 4). The observed interactions were primarily salt resistant. For a discussion of lack of reciprocal SynCAM 4/3 binding, see the Results. Numbers on the left indicate positions of molecular weight markers. Arrowheads show the running positions of the indicated SynCAM proteins in their predominantly adult (black) and postnatal (white) glycosylation forms. Input and FT lanes contain 10% of the extract used for each affinity chromatography. b–d, SynCAM proteins 1/2 and 3/4 interact in trans to confer heterophilic cell adhesion. HEK 293 cells were individually transfected with constructs encoding the indicated epitope-tagged SynCAM proteins, and cells were mixed in a 1:1 ratio. Localization of individual SynCAMs at sites of cell–cell contact was analyzed by fluorescence microscopy and is shown in gray scale as indicated. Bottom, Merged images (flag-tagged constructs, red; CFP-tagged constructs, green). To assess interactions of SynCAM 1, HEK 293 cells were transfected with SynCAM 1-flag and mixed with HEK 293 cells expressing either SynCAM 2-CFP (b) or SynCAM 3-CFP (c). b, SynCAM 1/2 heterophilic cell–cell interactions were readily detected, consistent with their strong biochemical interaction observed in a. c, No strong cell adhesive interactions were demonstrated in this assay for SynCAM 1 and 3. d, To assess interactions of SynCAM 4, HEK 293 cells transfected with SynCAM 4-CFP were mixed with HEK 293 cells expressing SynCAM 3-flag, and SynCAM 3/4 heterophilic cell–cell interactions were detected. Arrowheads mark SynCAM protein aggregation at sites of cell–cell contact. All constructs were epitope tagged within their intracellular sequences, which did not interfere with plasma membrane sorting as described in Figure 5b. The SynCAM 1-flag/1-CFP homophilic interaction served as positive control (data not shown). e, Model of heterophilic interactions between SynCAM family members. SynCAM 1 and 2 as well as 3 and 4 form two strong cognate cell adhesion pairs. In addition, SynCAM 1 and 3 can bind more weakly. The additional homophilic interactions of SynCAM 1, 2, and 3 are not shown. Ig-like domains are represented as barrels, N-linked carbohydrates as hexagons, and O-linked carbohydrates as rhombi. Predicted glycosylation sites in SynCAM proteins are drawn to scale (Biederer, 2006).
