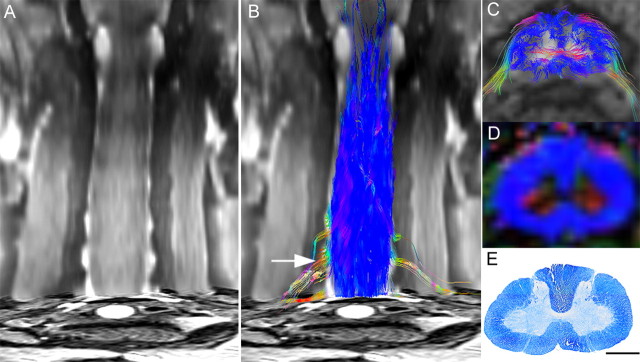
Figure 1.
DTT of the intact spinal cord in a postmortem common marmoset. A, Coronal T2-weighted MRI. B, C, Full-width DTT of the spinal cord (B) and an axial section (C) superimposed on axial T2-weighted images. The ROI was placed in the lower cervical spinal cord and DTT was traced in the cranial direction. DTT tracts are color coded to indicate tract orientation: red for left–right orientation, green for anterior–posterior orientation, and blue for superior–inferior orientation. D, E, Directionally color-coded axial FA map of the spinal cord (D) reveals that the configuration of the white matter depicted in blue is consistent with the myelin-positive area in an axial section of the same area stained with LFB (E). C–E are axial images of the C5/6 level (B, arrow). Scale bar, 1 mm.

