
Figure 5.
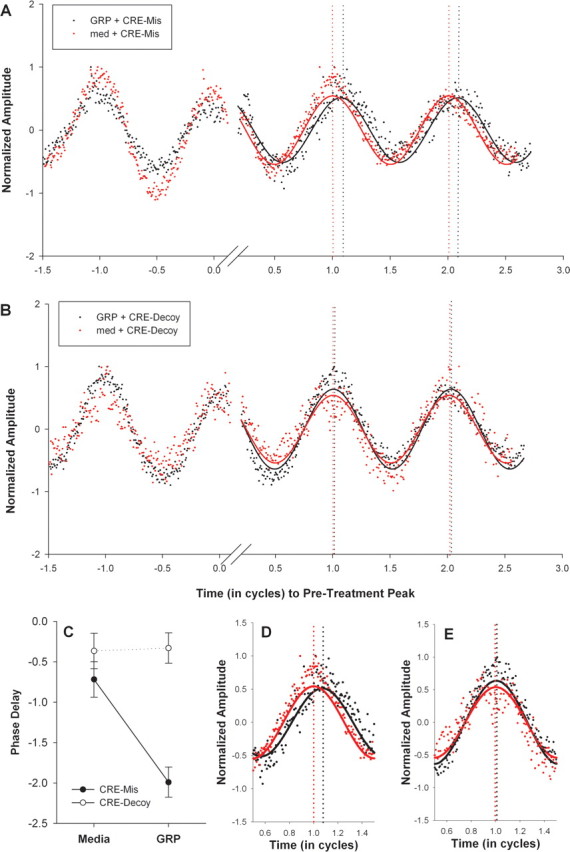
A, B, Bioluminescence recorded from SCN explants cultured from PER2::LUC mice after treatment with CRE-mis (A) or CRE-decoy (B) at CT 15–CT 16. Baseline-subtracted traces (see Materials and Methods) within each graph are from the same culture treated with GRP (black) or culture medium (med; red). The luminescence amplitude (y-axis) was normalized to the maximum luminescence for that trace. The x-axis represents time in cycles (where 1 cycle = 24/free-running period). The two traces in each graph were aligned to the peak just before treatment (defined as time 0) to allow phase-shift comparison. The solid lines indicate the fitted sine wave for the luminescence data points from cultures treated with GRP (black) or media (red). For the CRE-mis culture (A), the phase difference between GRP and medium is 0.098 cycles, which equals 2.34 h. For the CRE-decoy culture (B), the phase difference between GRP and medium is 0.014 cycles, which equals 0.34 h. C, Line graph of average ± SEM phase delays: filled circles represent cultures that received CRE-mis, and open circles represent cultures that received CRE-decoy. Each culture was treated with GRP or medium for 1 h at CT 15–CT 16 (in which CT 12 is defined as peak PER2::LUC luminescence). Every culture received both conditions (GRP and medium in a counterbalanced order), which were separated by two rinses and a medium change. D, E, Enlarged bioluminescence traces of the first cycle after GRP (black) or culture medium (red) treatment at CT 15–CT 16 for the CRE-mis-treated (D) and a CRE-decoy-treated (E) cultures in A and B above.