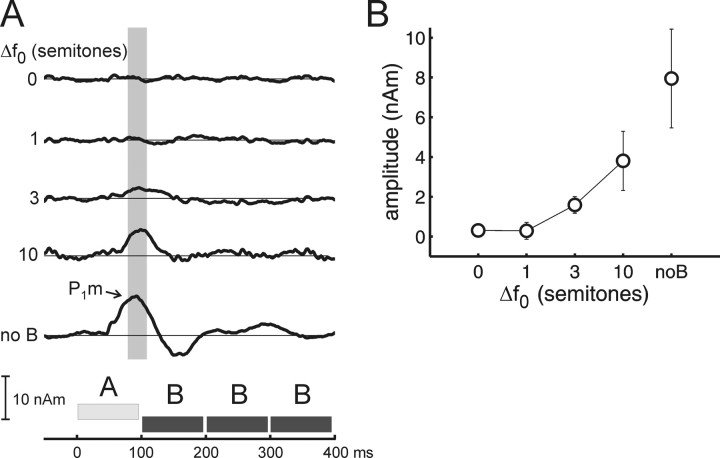
Figure 5.
Increasing MEG source amplitude with increasing Δf 0. A, Source waveforms for each semitone difference, averaged across subjects and hemispheres. B, Average amplitude of the P1m ± one SE measured in the fixed interval from 80 to 110 ms post stimulus onset (compare gray box in A; latency corrected for air conduction delay in the MEG sound delivery system and adjusted to the middle of the 5 ms onset ramp).

