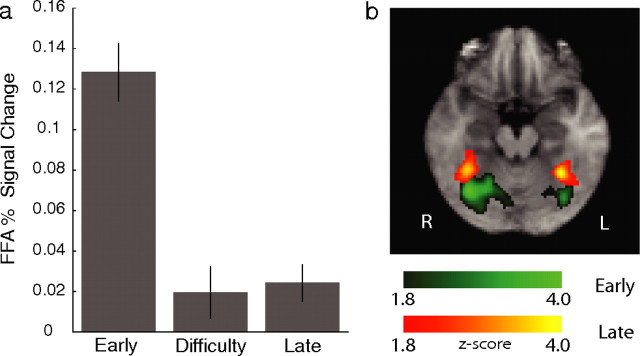
Figure 4.
Fusiform gyrus activations. a, Mean percentage signal change in the FFA, as identified by separate localizer scans, across subjects and for each of the three components. The highest percent signal change in the FFA can be explained primarily by the early component. Error bars represent ±1 SEM. b, Fusiform gyrus activations correlating with the early (green) and late (yellow) components respectively as revealed by the group analysis. Significant activations are corrected for whole-brain multiple comparisons. Together these results suggest that the early component activations might have arisen primarily by the source seen for the localizer scans. The late component activations however are likely independent of those of the localizer scans.

