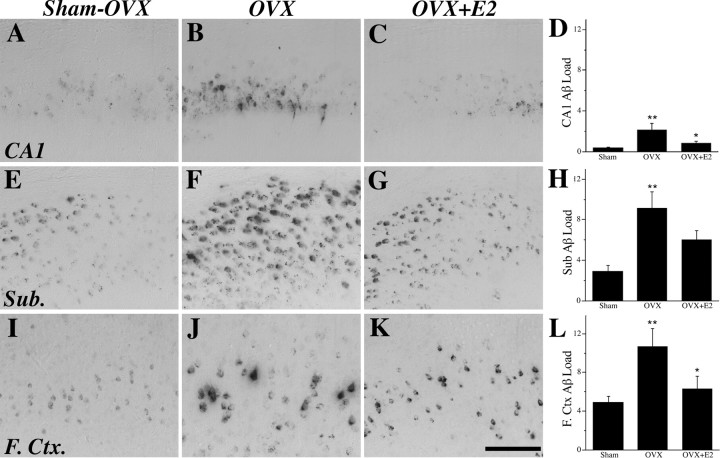
Figure 6.
E2 regulates Aβ accumulation. Aβ-IR was visualized in female 3xTg-AD mice at age 6 months in the sham OVX (A, E, I), OVX (B, F, J), and OVX+E2 (C, G, K) groups in hippocampus CA1 (A–C), subiculum (Sub.; E–G), and frontal cortex (F.Ctx.; I–K), as shown in representative images. Scale bar, 100 μm. Data demonstrate that mean ± SEM Aβ load differed significantly across treatment groups in hippocampus CA1 (F = 4.40, p = 0.028) (D), subiculum (F = 6.77, p = 0.007) (H), and frontal cortex (F = 4.30, p = 0.031) (L). *p < 0.05 relative to OVX group; **p < 0.05 relative to sham OVX group.

