
Figure 3.
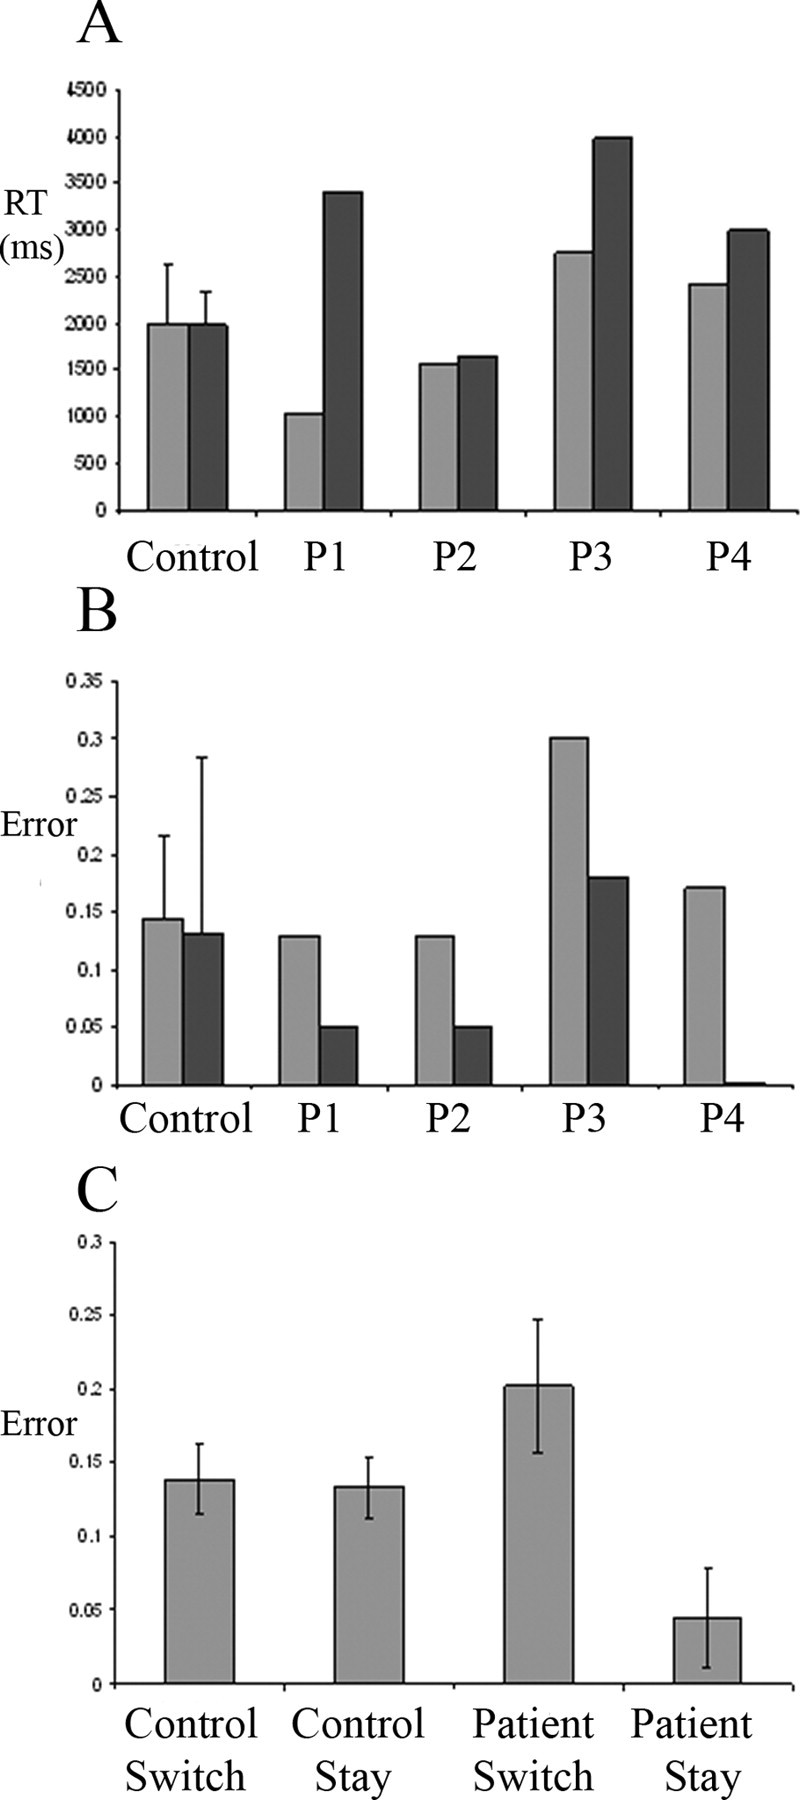
A, Reaction times (RT). B, Error rates for the control group and each patient (P1–P4). In A and B, spatial tasks are indicated by light gray bars, and verbal tasks are indicated by dark gray bars. C, Error rates are shown separately for trials in which the modality had just switched (switch) or was the same as the previous trial (stay), for control and patients groups, respectively, averaging across modality. Control data are shown as group mean ± SE.