
Figure 7.
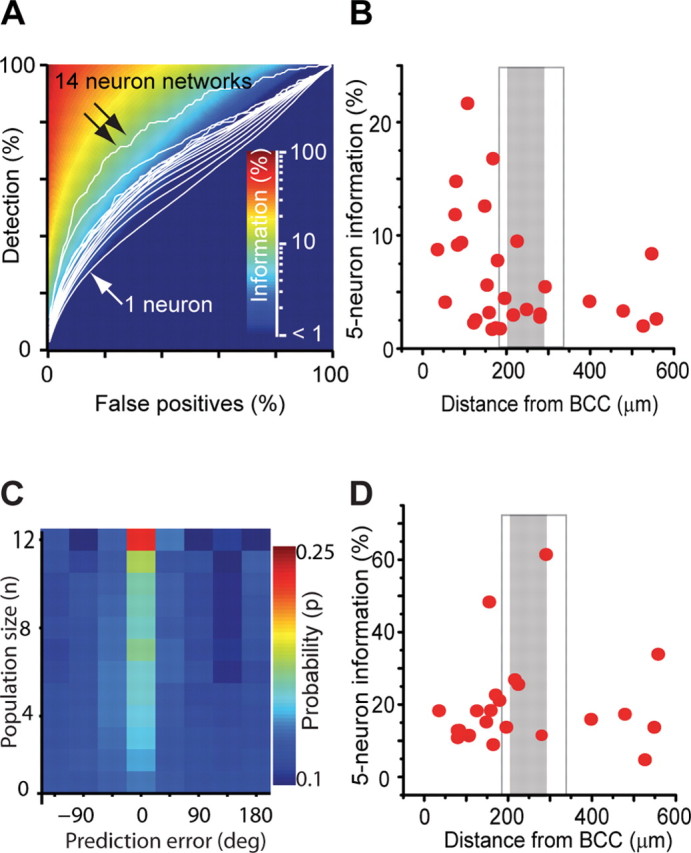
Stimulus representation in local populations depends on location. A, Mean detection rate (white contours) as a function of false-positive rate for populations containing between one neuron (single arrow) and 14 neurons (double arrow). For each combination of detection rate and false-positive rates, the percentage of information captured by the decoder is color coded. B, Average decoded information (α = 0.08) for five-neuron populations as a function of distance from BCC. Each point corresponds to an average of all possible randomly selected five-neuron combinations from within a single population of simultaneously recorded neurons (n = 29 populations). Distance from BCC was calculated as a mean over all neurons in the population to the center of the intrinsic imaging spot. A significant association was observed (p = 0.02). C, Probability distribution (p) of angle decoding error (in degrees) for increasing population size (n). The peak at zero error for larger population sizes indicates improving accuracy (n = 26 populations). D, Average decoded information for deflection angle from five-neuron populations as a function of distance from BCC. Each point corresponds to an average of all possible randomly selected five-neuron combinations from within a single population of simultaneously recorded neurons (n = 22 populations). Distance to BCC was calculated as a mean over all neurons in the population. No significant association was observed (p = 0.21).