
Figure 1.
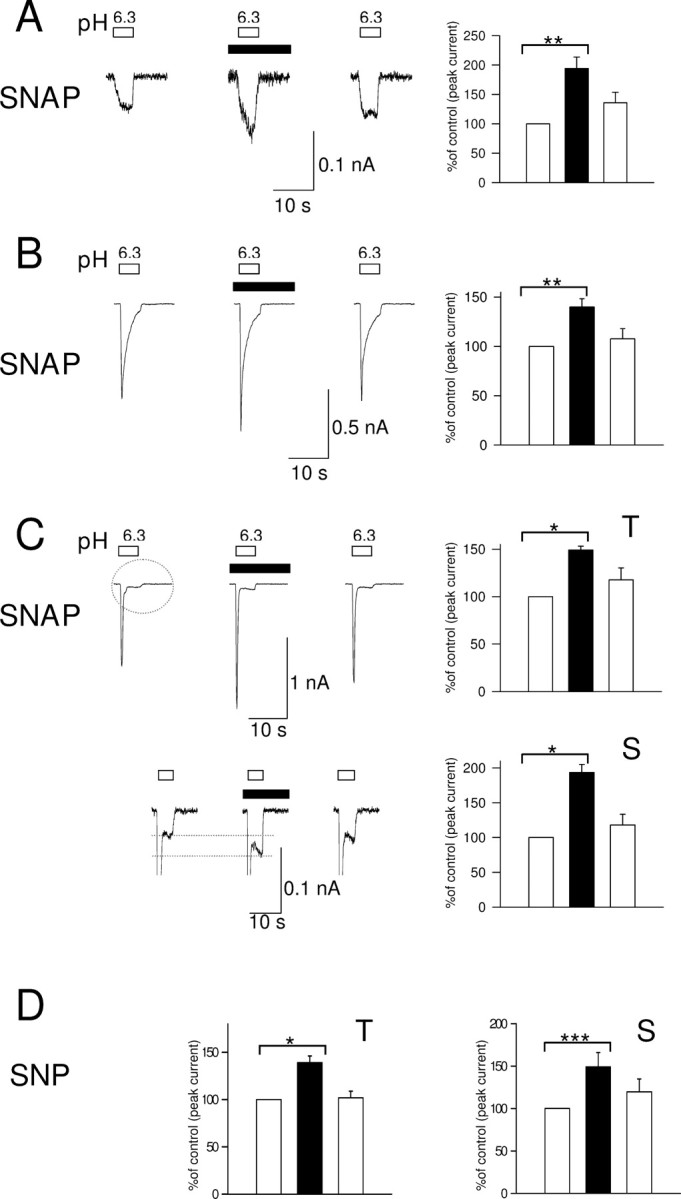
A–C, Potentiation of the three types of proton-gated currents in rat neonatal DRG neurons by the NO donor SNAP (100 μm). Whole-cell patch clamp, holding potential −80 mV. Left panels, Current evoked by eighth application of pH 6.3 solution (white bar), third application of pH 6.3 in the presence of SNAP (100 μm, black box), and fourth application of pH 6.3 after wash. Right panel shows current normalized to control (100%, left column). A, Potentiation of sustained current by SNAP (n = 6). B, Potentiation of slowly inactivating current by SNAP (n = 8). C, Potentiation of rapidly inactivating current by SNAP (n = 8). Top shows potentiation of peak of rapidly inactivating current (T), and bottom shows potentiation of sustained component (S, circled). D, Potentiation of transient (T) and sustained (S) phases of rapidly inactivating current by SNP (10 μm). Data in all bar graphs are shown relative to control. Error bars show ±SEM. Statistical tests in this and other figures were performed on raw data using paired t test, and significance is shown as follows: *p < 0.05; **p < 0.01; ***p < 0.001.