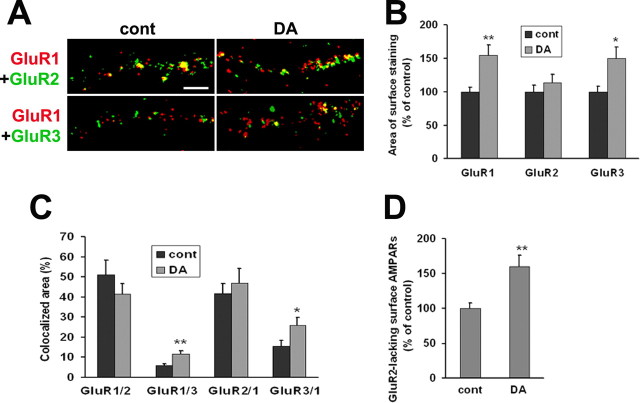
Figure 10.
Surface expression of GluR2-lacking receptors is increased after 24 h of recovery from prolonged DA exposure. A, In VTA-PFC cocultures, cells were treated with media [control (cont)] or DA (1 μm) for 1 h. After 24 h of recovery, live cells were double labeled with antibodies recognizing the extracellular N-terminal domains of GluR1 and GluR2 or GluR1 and GluR3. Images depict surface expression of GluR1 (red), GluR2 or GluR3 (green), and overlays showing area of colocalization (yellow). Scale bar, 5 μm. B, After 24 h of recovery from DA exposure (1 h), the areas of surface staining for GluR1 and GluR3 were increased, whereas GluR2 staining was not altered (n = 18–23; t test, *p < 0.05, **p < 0.01). C, Area of colocalization for different pairs of AMPA receptor subunits. The labels on the x-axis indicate the pair analyzed. For example, GluR1/2 refers to the percentage of total GluR1 staining that is colocalized with GluR2, and so forth. The area of colocalized surface staining for GluR1 and GluR3 (GluR1/3 and GluR3/1) was increased after DA treatment (n = 18–23; t test, *p < 0.05, **p < 0.01), whereas colocalization of GluR1 and GluR2 (GluR1/2 and GluR2/1) was not (n = 18–23; t test, p > 0.05). D, The area of GluR1 surface staining that was not colocalized with GluR2 was used as a measure of surface expression of putative GluR2-lacking AMPA receptors. This measure was increased after DA treatment compared with the control group (n = 18–23; t test, **p < 0.01).

