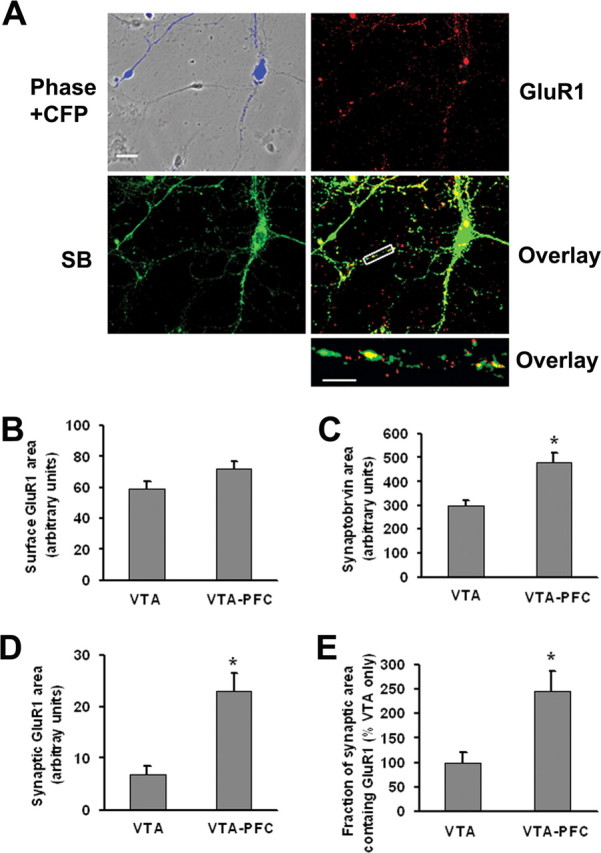
Figure 5.

VTA-PFC cocultures exhibit higher synaptic GluR1 levels than pure VTA cultures. A, VTA and PFC neurons in VTA-PFC cocultures can be distinguished, enabling selective monitoring of AMPA receptors on VTA neurons, because only PFC cells express ECFP. Images show ECFP fluorescence (blue), GluR1 surface expression (red), synaptobrevin expression (SB, green), overlay of GluR1 and synaptobrevin staining (yellow), and a high-magnification overlay of a neuronal process for a putative DA neuron in VTA-PFC coculture. Scale bars: top four panels, 20 μm; bottom, 5 μm. B–E, Quantitative results comparing VTA cultures and VTA-PFC cocultures. B, Surface GluR1 did not differ significantly between VTA cultures and VTA-PFC cocultures (n = 19–20, t test, p > 0.05). However, synaptobrevin area (C), synaptic GluR1 area (D) and the fraction of synaptic area containing GluR1 (E) were all significantly greater for DA neurons in VTA-PFC cocultures compared with VTA cultures (n = 19–20; t tests, *p < 0.05).
