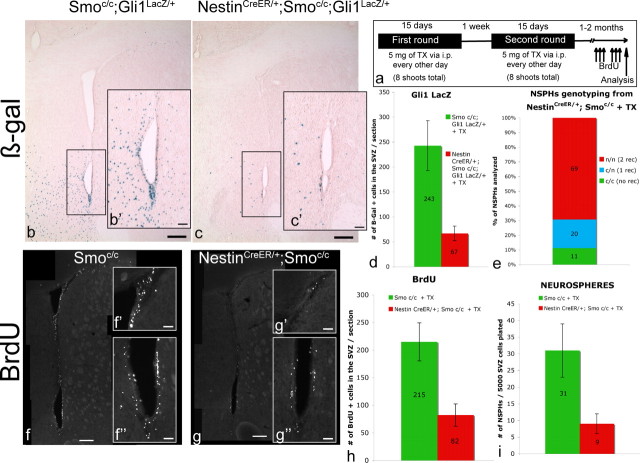
Figure 5.
Loss of Hh signaling in tamoxifen-treated NestinCreER; Smoc/c mice in the adult SVZ. a, Diagram of the tamoxifen treatment the NestinCreER/+; Smoc/c mice (ko) and Smoc/c mice (controls) undergo, combined with the BrdU treatment. b, c, Coronal views of the adult SVZ showing β-Gal staining representing the expression pattern of the readout of Hh pathway, Gli1, in tamoxifen-treated Smoc/c; Gli1LacZ/+ mice (b, b') and tamoxifen-treated NestinCreER/+; Smoc/c; Gli1LacZ/+ mice (c, c'). d, A quantification of the reduction in Gli1 expression in the SVZ. e, Results of PCR genotyping performed on individual neurospheres obtained from tamoxifen-treated NestinCreER/+; Smoc/c mice. Note that n/n means that both events of recombination occurred; c/n means that only one event of recombination occurred; c/c indicate that no recombination occurred in the Smo conditional alleles. f, g, Coronal views of the adult SVZ showing BrdU-incorporating cells in tamoxifen-treated Smoc/c mice (f–f“) and in tamoxifen-treated NestinCreER/+; Smoc/c mice (g–g”) soon after BrdU injections. h, Quantification of the data shown in f and g. i, Quantification of the numbers of neurospheres generated from the SVZ of tamoxifen-treated NestinCreER/+; Smoc/c and controls. Scale bars: b, c, 200 μm; b', c', 50 μm; f, g, 150 μm; f', f“, g', g”, 30 μm. Error bars represent SD. Statistics were performed by t test, p < 0.05. In d, h, i, n = 3 animals each. In e, n(NSPHs) = 925, 4 animals.

