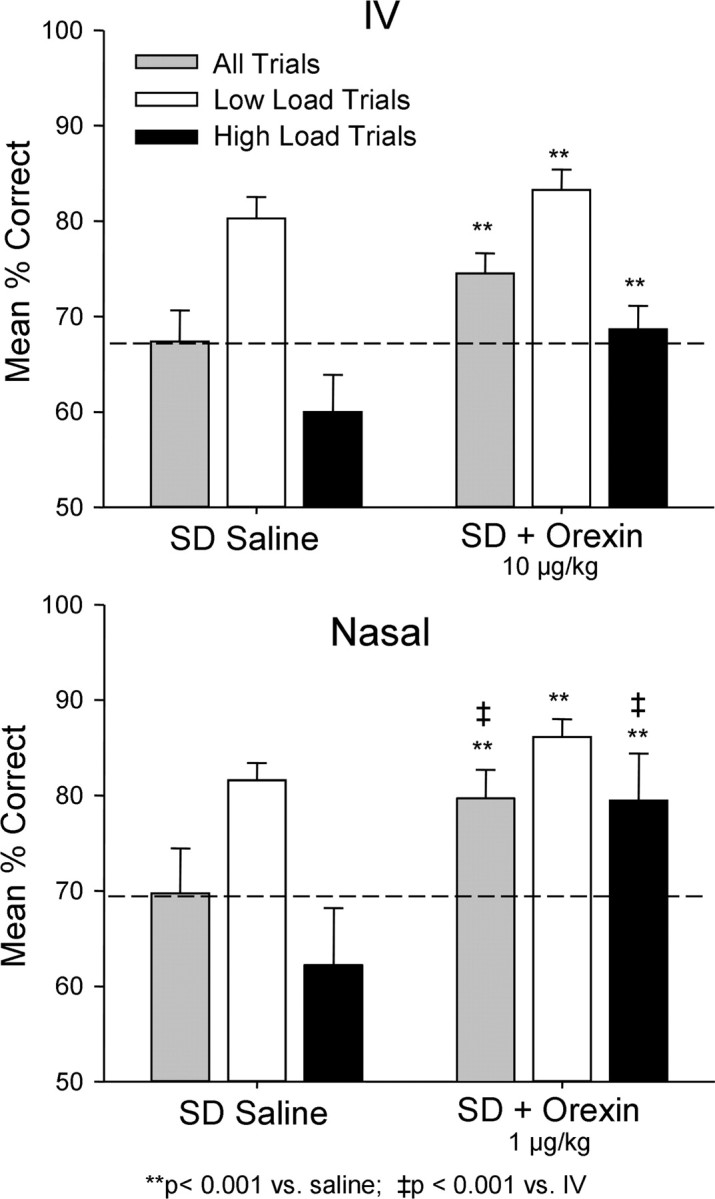
Figure 5.

Comparison of i.v. orexin-A and nasal orexin-A on reversal of the effects of sleep deprivation (SD) on DMS performance. The same performance data as in Figures 1 and 3 are plotted to show comparison of effects of two delivery methods on mean percentage correct (± SEM) performance relative to very similar saline sleep deprivation (SD) performance levels (dotted line). **p < 0.001, difference relative to each respective saline sleep deprivation condition; ‡ p < 0.001, difference between i.v. versus nasal orexin A in sleep deprivation condition.
