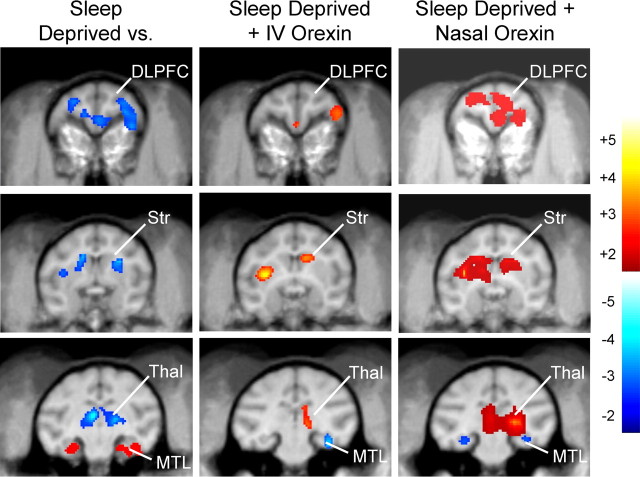
Figure 6.
Orexin-A reverses the effects of sleep deprivation on brain regional CMRglc changes measured during DMS task performance. Difference images of PET scans obtained in the each of the two experimental conditions indicated at the top of each column are shown as composites for all monkeys (n = 8) plotted on representative coronal MRI images. Scaled color changes (color bar, far right) indicate magnitude of local CMRglc during performance of the DMS task as determined from SPM constructed voxel maps. Each column shows three different rostrocaudal brain levels to illustrate changes in specific brain regions engaged by the task. Left, Local CMRglc in the three indicated brain regions was differentially altered by sleep deprivation compared with alert sessions as shown by decreased CMRglc in DLPFC, Str, Thal, and increased CMRglc in MTL. Middle, Administration of i.v. orexin-A (10.0 μg/kg) to the same monkeys that were sleep deprived and tested in the same manner (Fig. 2) showed increased local CMRglc relative to sleep-deprived saline sessions in DSLFC, Str, and Thal and decreased CMRglc in MTL. Right, Administration of nasal orexin-A (1.0 μg/kg) to sleep-deprived monkeys produced marked increases in local CMRglc relative to sleep-deprived saline sessions in DSLFC, Str, and Thal and as well as decreased CMRglc in MTL. Color scale at right depicts degree of increase (red to yellow) or decrease (dark blue to light blue) in local CMRglc relative to comparison image. DLPFC, Dorsolateral prefrontal cortex; Str, striatum; Thal, thalamus; MTL, medial temporal lobe.

