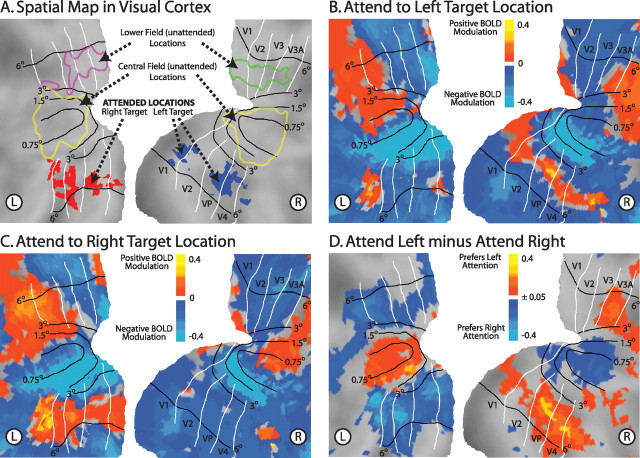
Figure 2.
Covert attention to a particular location, in the absence of visual stimulation, modulates activity representing all locations. A, Visual cortex contains a spatiotopic map in which nearby portions of cortex represent nearby portions of space. Representations of the target locations in the experimental task, as well as unattended locations in the lower and central fields, are displayed on a flattened representation of early visual cortex. These outlines are based on independent localizer scans. B, C, Endogenous BOLD activity after cues to covertly attend to the top left (B) or top right (C) target location (5° eccentricity) in the absence of visual stimulation. Note the swath of positive modulation corresponding to the attended location for each condition. BOLD activity in early visual cortex corresponding to the rest of the visual field is mostly negative. This creates a sharp peak of activity at the portion of visual cortex representing the attended location. D, The difference in endogenous BOLD activity between trials with leftward and rightward cues. Portions of cortex representing the attended locations show the largest differences. Cortex representing the lower visual field also shows a weak preference for attending to the contralateral hemifield. Portions of cortex representing the center of the visual field, however, show lower BOLD activity for attending to the contralateral versus ipsilateral hemifield, thus showing a preference for ipsilateral attention. White lines are approximate borders between retinotopic visual areas based on a standard atlas (Van Essen, 2002). Black lines are approximate isoeccentricity lines based on an average of six subjects from another study (Jack et al., 2006). Data maps are summed over the last two pretarget MR frames (frames 5 and 6), smoothed with a 5 mm full-width at half-maximum Gaussian kernel, averaged across subjects, and projected onto a flattened representation of posterior occipital cortex using the PALS (population-average, landmark, and surface-based) atlas (Van Essen et al., 2001).

