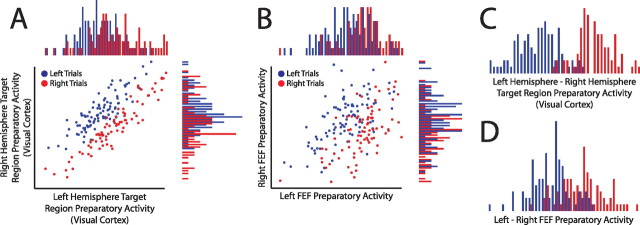
Figure 4.
Activity in portions of cortex representing the left and right target locations is positively correlated across trials. A, Plot of trial-by-trial preparatory activity in the portion of visual cortex representing the right location (left hemisphere) versus preparatory activity in the portion representing the left location (right hemisphere). Each dot represents a single trial. The histograms on the x and y axes are projections of the trial data and display the distributions of preparatory activity for the left and right hemispheres, respectively. Although the signal related to the locus of spatial attention goes in opposite directions for the regions from opposite hemispheres, preparatory activity is nevertheless positively correlated across trials. Accounting for this positive correlation could dramatically improve the ability to decode the locus of spatial attention. This can be seen by noting that although there is a clear separation between the dots corresponding to the leftward and rightward cued trials, the histograms reveal that there is much less separation within either single region. B, Same as A for FEF. C, D, Histograms of preparatory activity derived by subtracting right hemisphere activity from left hemisphere activity for the same data plotted in A and B. The relative activity is clearly better at distinguishing between leftward versus rightward covert attention than activity in either left or right regions alone. All data are from a random half of the trials from a single subject (2).

