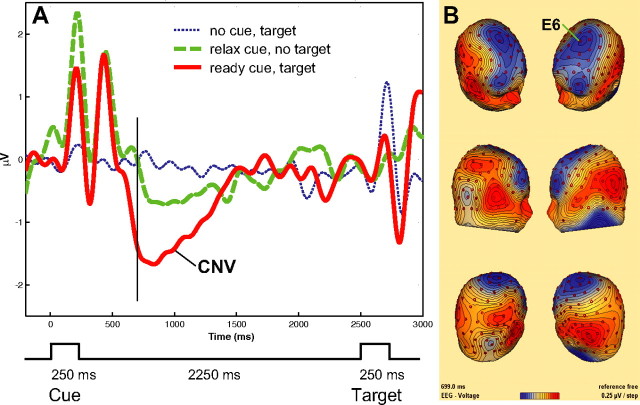
Figure 3.
A, ERP waveforms as a function of cue type. The ERP amplitude was greater in the ready cue than in the relax cue condition at ∼700 ms after the cue onset. B, Scalp topography of the voltage difference of ready cue minus relax cue at 699 ms. The time point corresponds to the vertical line in A. E6 indicates the location of the electrode with the maximum CNV amplitude.

