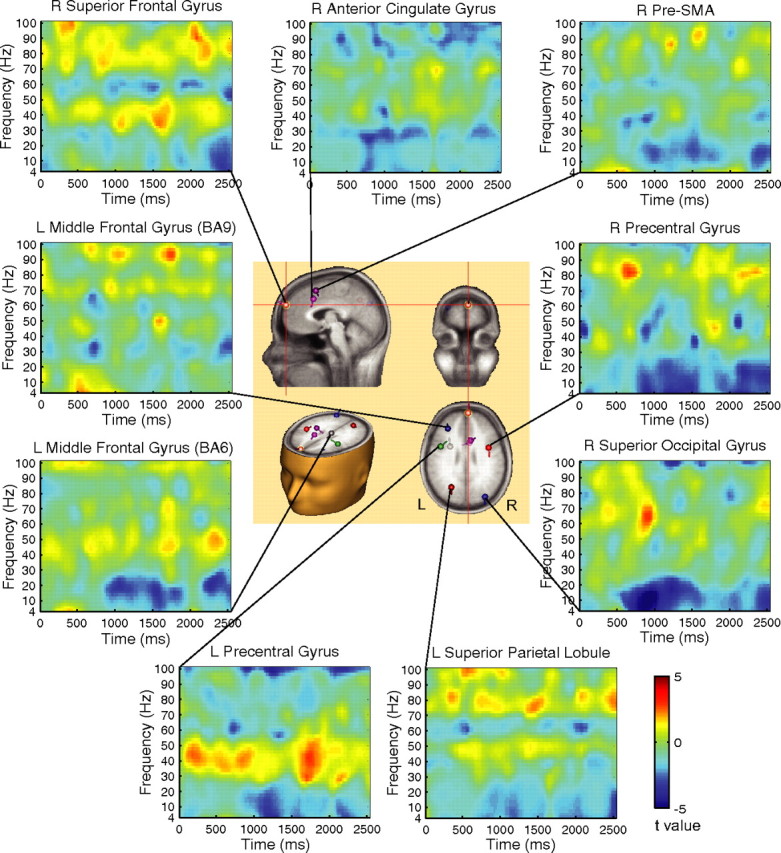
Figure 5.

Power change difference diagrams for the ready minus relax cue contrast as a function of time–frequency and the dipoles of ERP data. The center panel shows the dipole locations. The small balls and bars represent the locations and orientations of the dipoles, respectively. The right superior frontal gyrus showed greater gamma (>30 Hz) power maintained over the cue–target interval, whereas the right superior occipital gyrus showed power decrease in theta (4–8 Hz), alpha (8–12 Hz), and beta (12–30 Hz) bands. The cue onset is at 0 ms, and the target onset is at 2500 ms.
