Figure 4.
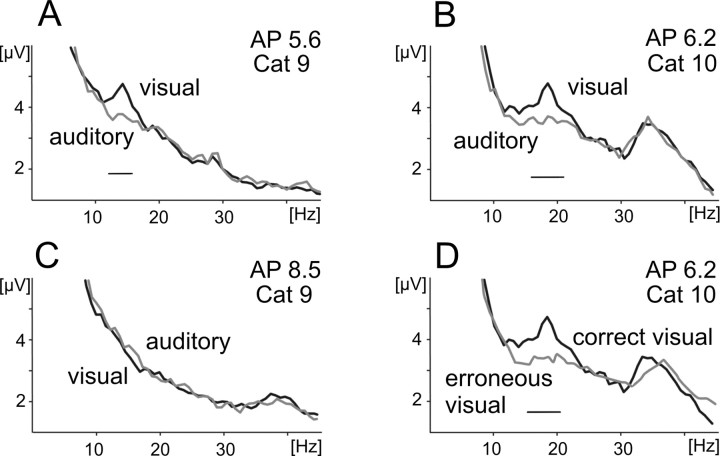
Increased β activity during attentive anticipation of the target stimuli in LPl-c. A–D, Mean visual and auditory FFT amplitude spectra obtained for LFPs recorded from individual sites in different regions of lateral zone of the lateral posterior–pulvinar complex in cat 9 (A, C) and 10 (B, D). The analysis encompassed signals recorded during the time interval between cessation of the cue and onset of the target stimuli. A–C contain exclusively those trials that ended with correct behavioral responses. The spectra are presented with reference to the location of the recording electrodes, i.e., from the most caudal (A) through intermediate (B) to the most rostral (C) site according to Horsley-Clarke coordinates (compare the exact locations in Fig. 5). A–C, Different recording sites are located in the ventromedial core of LPl-c (A), the dorsolateral region of LPl-c (B), and the rostral part of LPl (C). D, FFT spectra averaged from visual trials ending with a correct response (black line) are compared with those ending with an incorrect behavioral response. Note the enhancement of low-frequency (β 1) activity in the ventrolateral region of LPl-c (A) and high-frequency (β 2) activity in dorsolateral region of LPl-c (B). No enhancement of β activity was observed in LPl-r (C) or during incorrectly ended visual trials in LPl-c (D; gray line). In each cat, ∼600 data epochs from first three recording sessions were used to calculate mean spectrum for trials with correct response and 50 epochs were taken to obtain mean spectrum for trials with incorrect reward choice. Other explanations are as in Figure 2.

