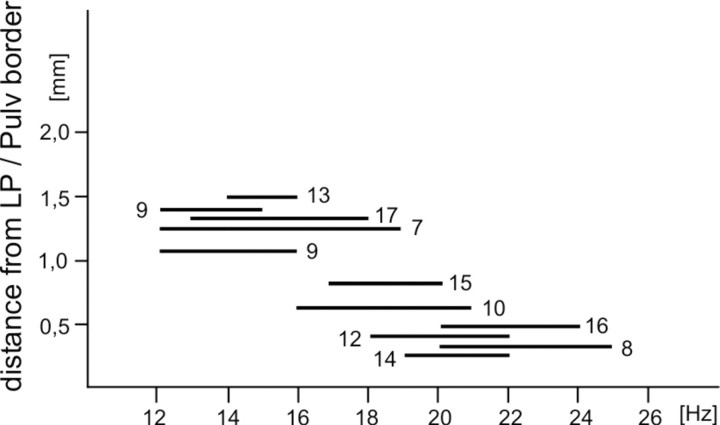
Figure 6.
Frequency ranges of significant differences between FFTs obtained from all recording sites in LPl-c. The LFP signals taken for analysis were recorded during correctly ended visual and auditory trials. Ordinate indicates shortest distance (in three-dimensional space) between the electrode location and the pulvinar border. Numbers specify experimental animals. Pulv, Pulvinar zone of LP-P.

