Figure 7.
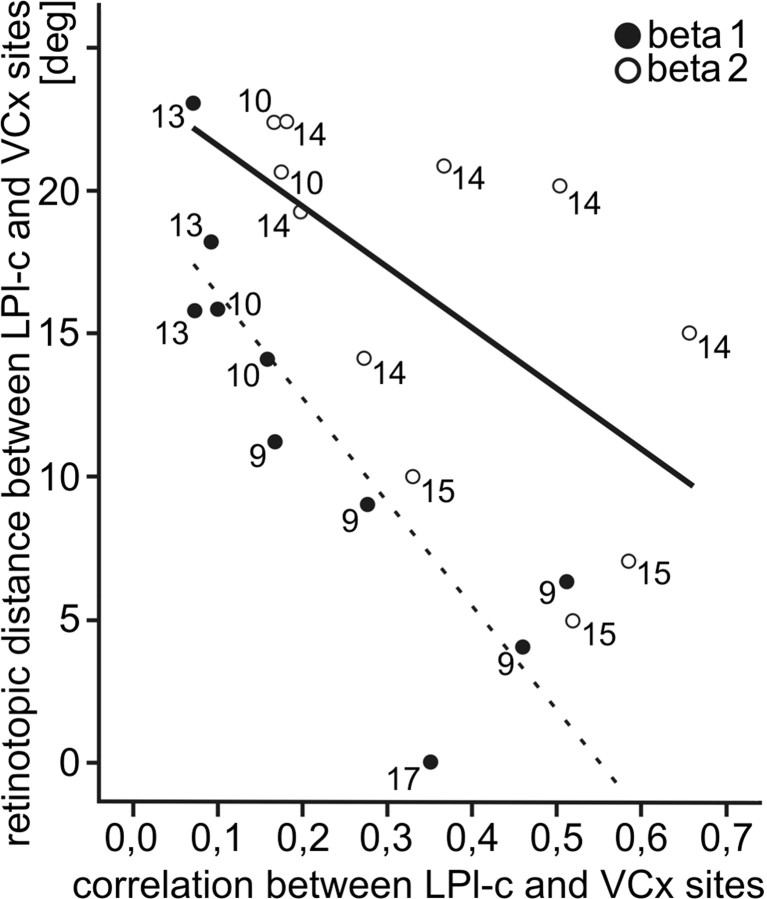
β Synchronization depends on the retinotopic distance between cortical and LPl-c recording sites. Phase-correlation coefficients calculated for the sample of corticothalamic pairs of LFP signals with matched ranges of increased attentional β activity plotted against distance between the retinotopic positions of cortical and thalamic sites are shown. The recordings from these pairs were filtered at β 1 (12–19 Hz) or β 2 (17–25 Hz) ranges. The two first seconds of recording after the presentation of the visual cue were taken for analysis. The graph shows correlation values averaged over visual trials from three to six experimental days. Filled circles indicate pairs of recordings from LPl-c and cortical sites that were characterized by the increased attention-related visual activity within the low-frequency (β 1) range. Open circles denote pairs of recordings showing increases in the high-frequency (β 2) range. Numbers indicate cats from which correlation values were calculated. Data recorded from cats 7, 12, and 16 were not included because of recording artifacts that did not allow for correlation analysis over a long period of time. Pearson's correlation for the whole sample, −0.509 (p = 0.018); within β 1 pairs, −0.851 (p = 0.002); and within β 2 pairs, −0.603 (p = 0.05).

