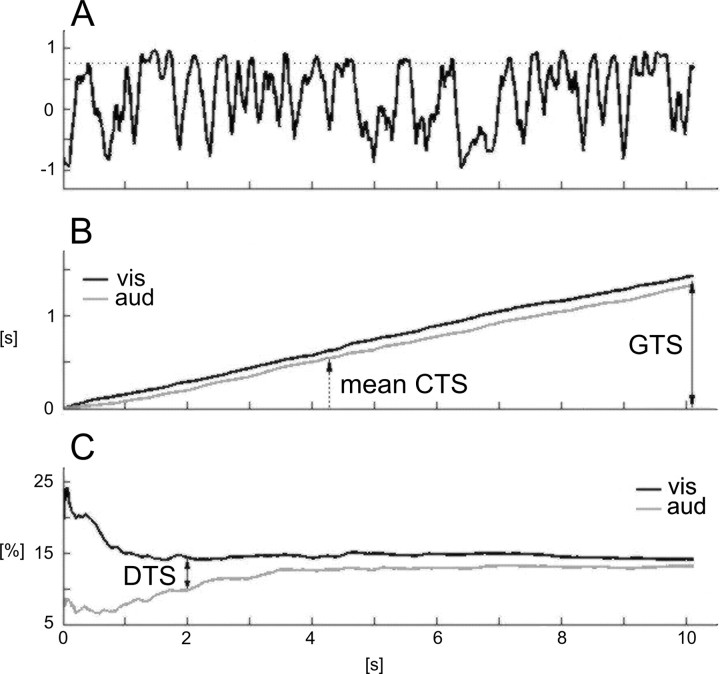
Figure 8.
An example of evaluating the DTS between two LFP signals. A, Running phase correlation calculated between 12 and 25 Hz β signals recorded during a single visual trial from two electrodes located in LPl-c and area 17 in cat 9. The time epochs during which the phase correlation exceeded 0.75 were continuously summed starting from the offset of the cue stimulus and formed a cumulated function for each experimental trial. B, The cumulated functions obtained from 38 visual (vis) and 45 auditory (aud) trials recorded in three consecutive daily sessions were averaged to measure CTS during visual and auditory trials. C, The relative time of high synchronicity as measured from the offset of the cue stimulus in relation to time of the trial (CTS × 100%/t). The mean percentage DTS between visual and auditory trials was measured at 2 s after cue stimulus offset and compared between all recording sites as shown in Figure 9.

