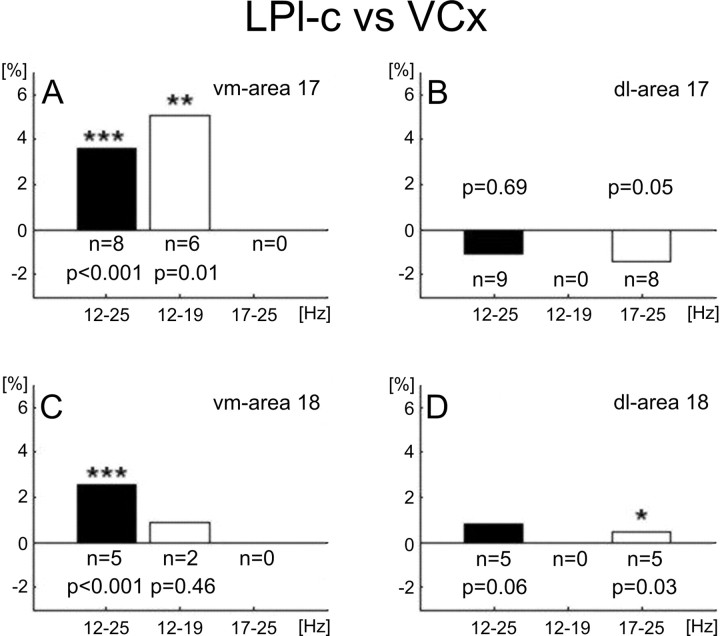
Figure 9.
Synchronicity between attentional β signals recorded from primary visual areas and LPl-c. Mean DTS values calculated for all connections between the visual cortex (areas 17 and 18) and two LPl-c regions (dorsolateral and ventromedial) are denoted by filled bars. Open bars indicate DTS values obtained between only those pairs of recordings that expressed matched β-frequency bands enhanced by the visual task (compare Tables 1, 2). The DTS values represent relative time of high thalamocortical synchronicity (>0.75) during visual trials minus relative time of thalamocortical high synchronicity during auditory trials and is measured at 2 s recording time after cessation of the cue stimulus (see Fig. 8 for additional explanations). A–D, Signal frequency bands from which DTS values were calculated are shown below each box. Each of the mean DTSs represent grand averaging across trials and all available electrode pairs for the connection type indicated in the top right corner of the appropriate graph (e.g., vm-area 17). The probability values over bars indicate significant differences between visual and auditory relative times of high synchronicity measured at 2 s (two-way ANOVA, with factors: modality and electrodes; the indicated probability values correspond to the modality factor). vm, Ventromedial part of LPl-c; dl, dorsolateral part of LPl-c; n, number of pairs for each bar.

