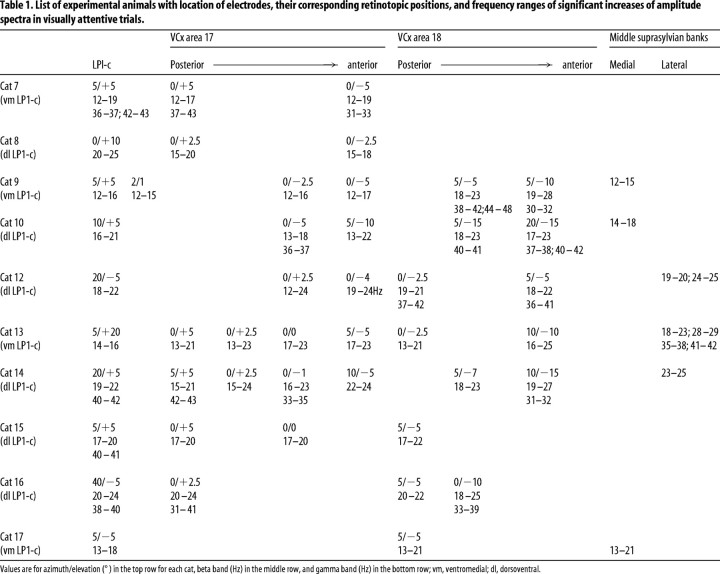
Table 1.
List of experimental animals with location of electrodes, their corresponding retinotopic positions, and frequency ranges of significant increases of amplitude spectra in visually attentive trials.
Values are for azimuth/elevation (°) in the top row for each cat, beta band (Hz) in the middle row, and gamma band (Hz) in the bottom row; vm, ventromedial; dl, dorsoventral.

