
Figure 4.
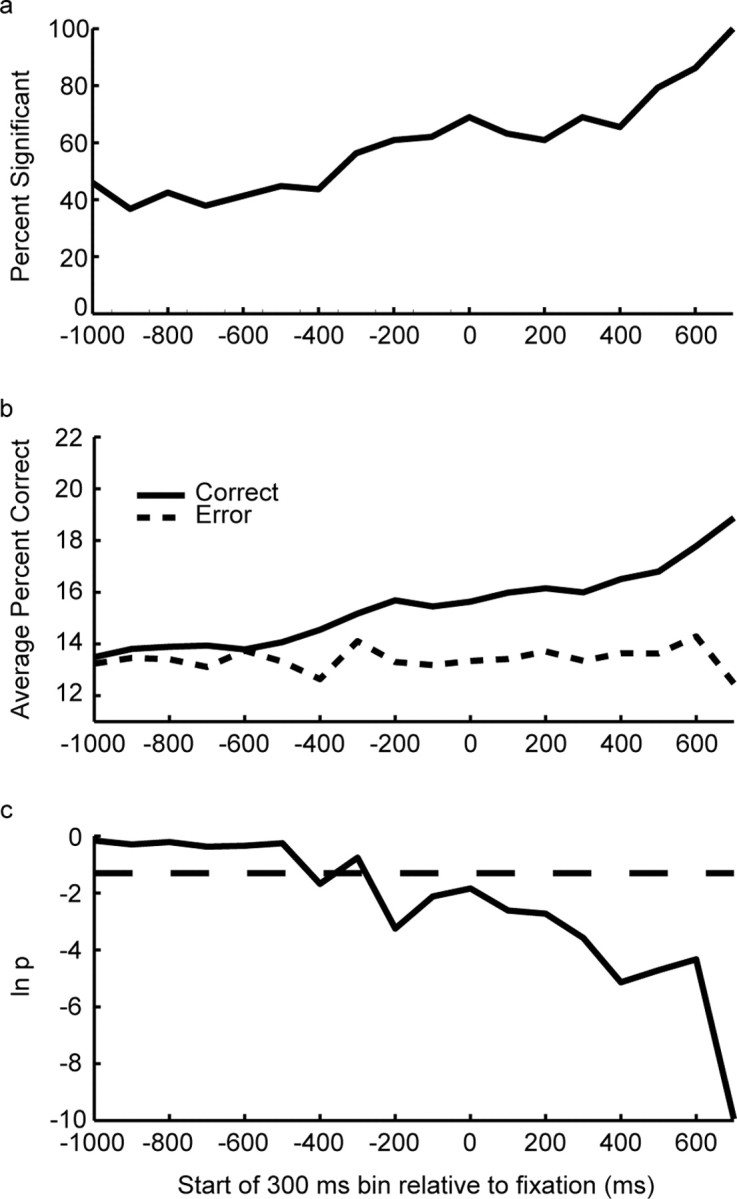
Representation of sequence during intertrial interval and fore-period. a, Percentage of individual neurons that showed a significant effect of sequence during the intertrial interval and the fore-period, expressed as a fraction of those that had a significant effect at the end of the fore-period. The time values indicate the start of the 300 ms bin. Time 0 is the bin beginning at fixation onset, and −1000 is approximately the end of the previous trial. b, Population average of percentage correct classification performance for correct and error trials. The vertical axis is percentage correct classification. c, ln(p) from likelihood ratio test of difference between correct and error curve shown in b. The dashed line indicates ln(0.05).