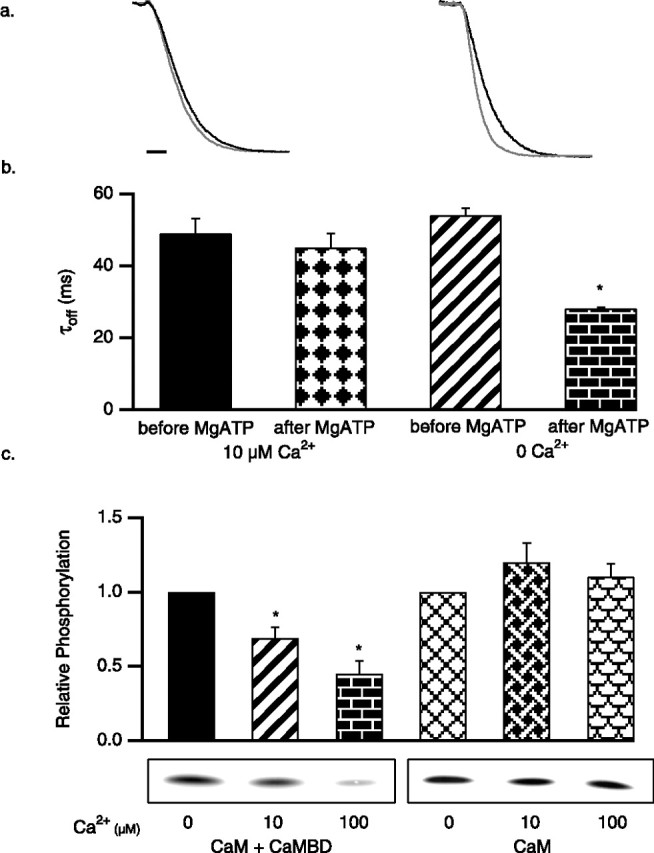
Figure 2.

CK2 activity for SK2-associated CaM is state dependent. SK2 current deactivation as in Figure 1, for control SK2 (black trace) and after application of 5 mm MgATP (gray trace; 45 s) in the presence of 10 μm (left) or 0 Ca2+ (right). Calibration, 50 ms. b, Average SK2 deactivation time constants derived from single exponential fits for the indicated conditions. c, In vitro CK2 phosphorylation reactions, stimulated by poly-l-lysine. Autoradiograph of phosphorylated CaM shows representative results for the conditions indicated, and the bar graph shows the average relative phosphorylation of CaM.
