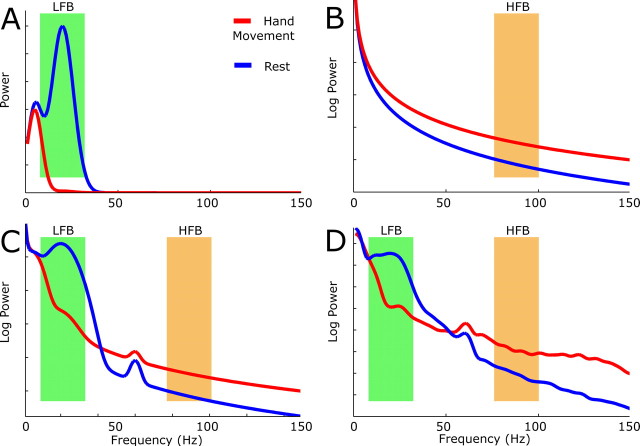
Figure 2.
The power spectra for the motor task (red) and rest intervals (blue) illustrate the rationale and tentative hypothesis behind the choice of spectral bands (HFB and LFB) for analysis. A–D, The first three plots (A–C) are elements of artificial schema, and the fourth (D) is actual data (the same as in Fig. 2). A, Modeling the ERD. In the rest condition, it is proposed that native timescales of 200 and 50 ms, generating spectral peaks based at 5 and 20 Hz, arise from cortical regulation by thalamus and/or other structures. With motor activation, one or more of these timescales decohere (“desynchronize”). Note that the rest period here does not necessarily reflect a baseline state, but the rest interval between actions, and may therefore be more coherent (“synchronized”) than a true baseline state. The schematic assumes 99% decoherence of the 20 Hz spectral peak with respect to the resting state. The green band reflects the analysis band (LFB) used to capture this effect. B, Modeling the broad spectral increase. In this model, a power law spectral shift from, for example, 1/f2.3 in the rest state to 1/f2 in the motor state, is diagrammed. This broad increase could also be a result of white noise addition to the data (a uniform shift upward). The orange band (HFB) is chosen to capture this shift because it is away from masking by discrete, native, timescales at lower frequencies (as in A) and noise contamination at 60 Hz. C, Superposition of the spectra in A and B, with the addition of 60 Hz noise (the same amount to each state). The orange and green bands are as before. D, Actual shift seen. This spectrum is the same as in Figure 2. Note the similarity to the modeled spectrum (C).

