
Figure 8.
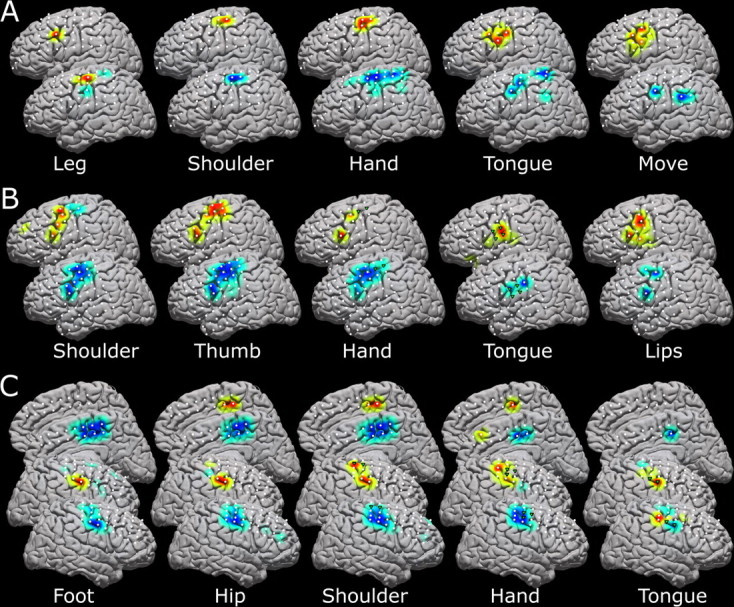
Five different movement modalities within the same patient for three different patients, with each relevant modality labeled. The top brains are high-frequency band representation, and the bottom are low-frequency representation. White dots indicate electrode positions, and the green triangles reflect the pairwise stimulation sites, which elicited movement of the concerned modality. A–C, Data for subjects 9 (A), 3 (B), and 16 (C) are shown. The medial representations in C reflect activation as reflected by a 2 × 8 interhemispheric strip, and the activations seen are likely supplementary motor areas rather than sensorimotor cortex.