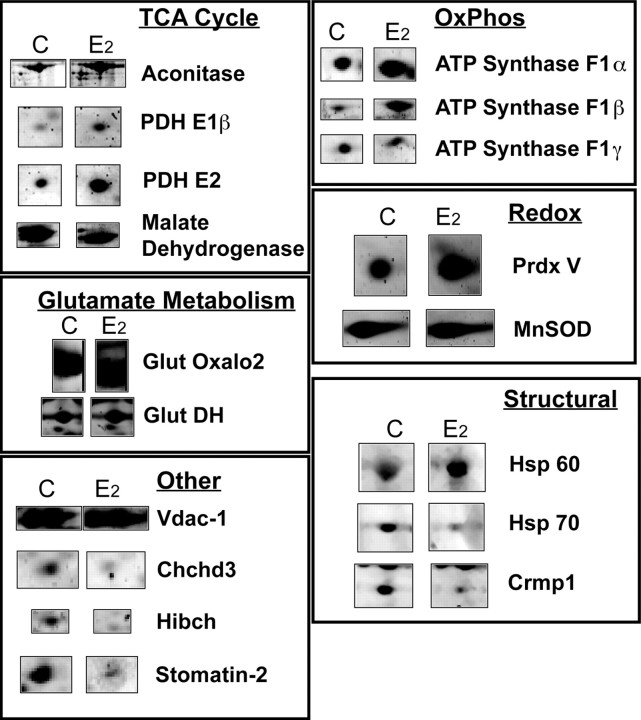
Figure 4.
Comparison of protein expression in 2D analysis. Individual protein spots are displayed in an expanded view for comparison of treatment groups. Subsets of identified spots are grouped by function category to represent protein expression patterns in the brain mitoproteome in response to E2 treatment.

