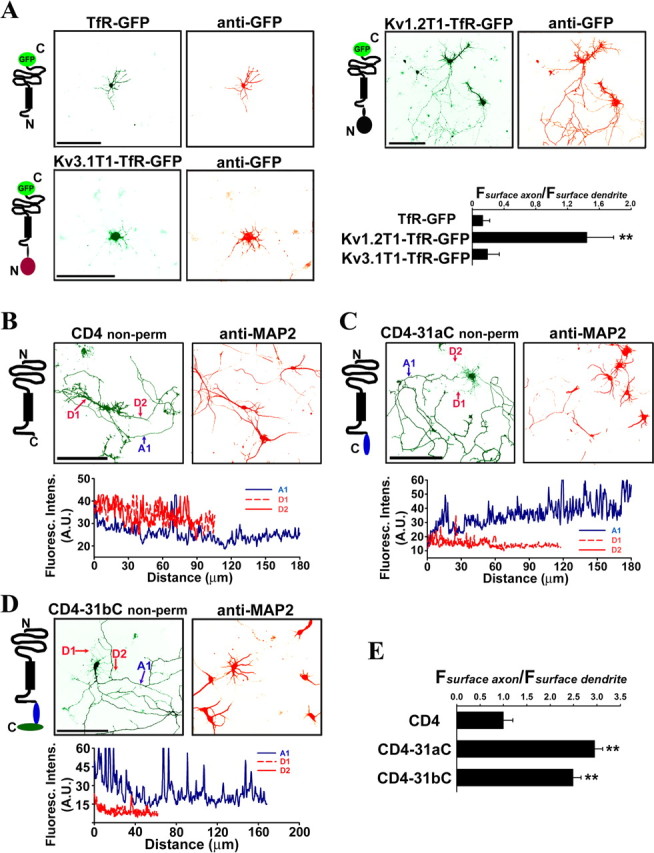
Figure 2.

Kv3.1 C-terminal regions enrich CD4 to axonal membranes. A, The Kv3.1 T1 domain did not increase the level of GFP-tagged transferrin receptor (TfR–GFP) in axons. Diagrams of TfR–GFP fusion proteins are on the left. TfR contains an intracellular N and extracellular C terminus with a single membrane-spanning segment indicated by a black bar. GFP fluorescence indicating the total protein level (green) is shown in the middle; anti-GFP staining under nonpermeabilized condition indicating the surface level of expressed fusion proteins (red) is on the right. TfR–GFP itself was primarily localized in the somatodendritic region (top left). The Kv1.2 T1 domain increased the level of TfR–GFP on axonal membranes (top right), whereas the Kv3.1 T1 domain did not (bottom left). Kv3.1T1–TfR–GFP was mainly restricted in soma and proximal dendrites and often formed punctate clusters along dendrites. The axon–dendrite targeting ratio for a fusion construct equals to the average anti-GFP immunofluorescence intensity along axons divided by the average intensity along dendrites (Fsurface axon/Fsurface dendrite), shown at the bottom right. B, CD4 is localized to both dendrites and axons. CD4 contains an extracellular N and intracellular C terminus with a single membrane-spanning segment indicated by a black bar. The CD4-transfected neurons were stained with anti-CD4 antibodies (green, top middle) under nonpermeabilized conditions and then permeabilized and stained for the dendritic marker MAP2 (red, top right). The anti-CD4 fluorescence profiles of the major axon (A1 in blue) and two dendrites (D1 and D2 in red) are shown in the bottom. C, The Kv3.1a C terminus (31aC) polarized CD4 targeting to the axonal membrane. D, The Kv3.1b C terminus (31bC) polarized CD4 targeting to the axonal membrane. E, Summary of polarized membrane targeting of CD4 fusion proteins. The polarity ratio (Fsurface axon/Fsurface dendrite) is equal to the average anti-CD4 fluorescence intensity along axons divided by the average intensity along dendrites. Distance 0, Soma. Scale bars, 100 μm. One-way ANOVA followed by Dunnett's test. **p < 0.0001.
