
Figure 2.
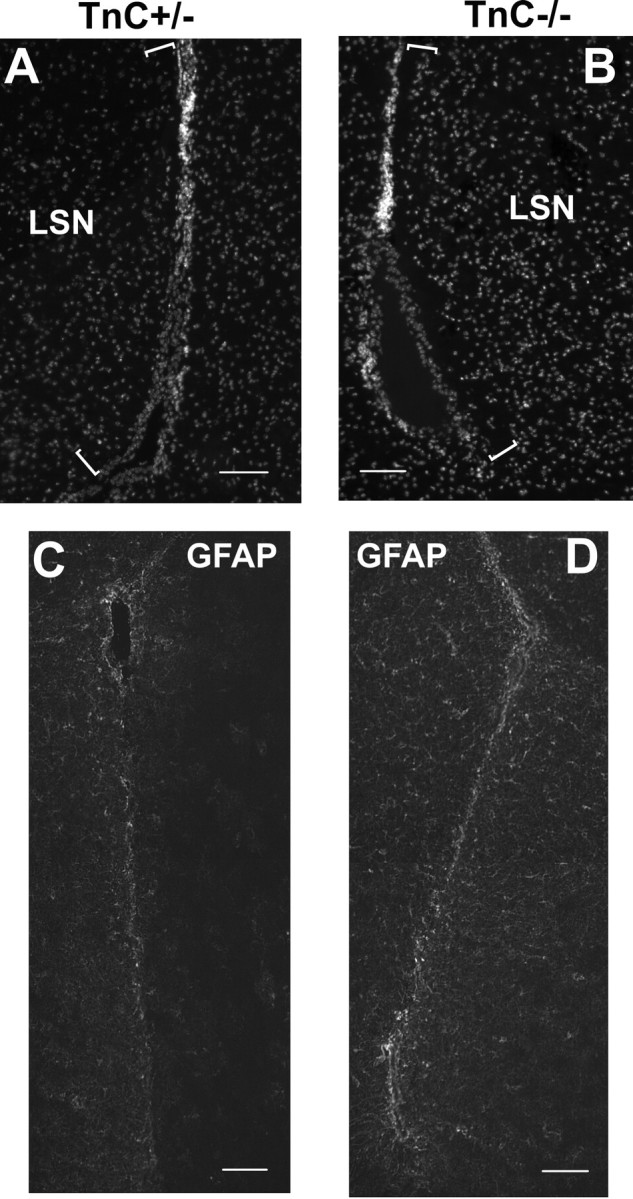
A, B, Representative images of the LSN area proximal to the LV (indicated by the brackets) from TnC+/− and TnC−/− mice, using Hoecsht staining to label nuclei. C, D, Characteristic GFAP immunostaining on day 0 in the LV area of TnC heterozygous (C) and null (D) mice. Scale bars: 100 μm.