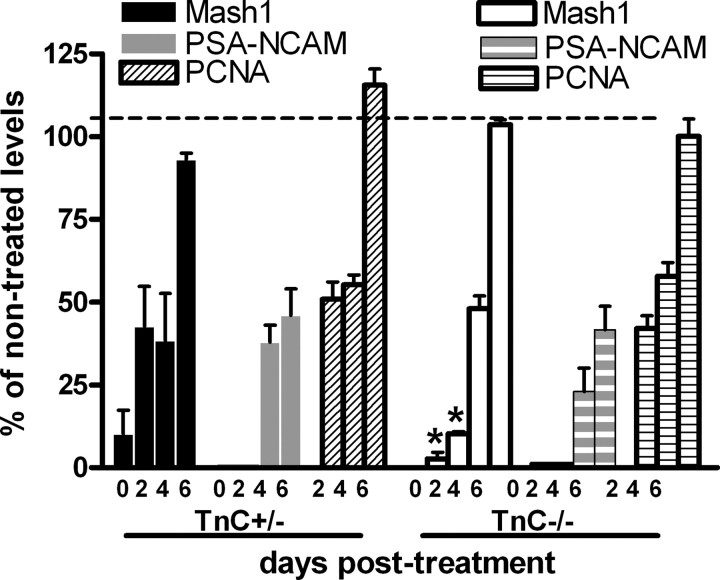
Figure 3.
Graph showing the numbers of type-C and type-A cells, as well as of PCNA-positive mitotic cells, in the infused hemisphere of TnC heterozygous and null mice after AraC treatment. The numbers are expressed as percentages of the pretreatment values. *p < 0.05, compared with the respective TnC+/− levels. Error bars indicate SD.

